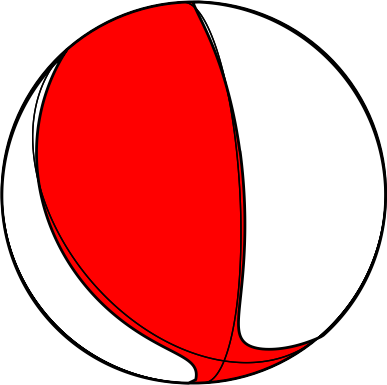
moment tensor best solution


| absolute | relative | |
|---|---|---|
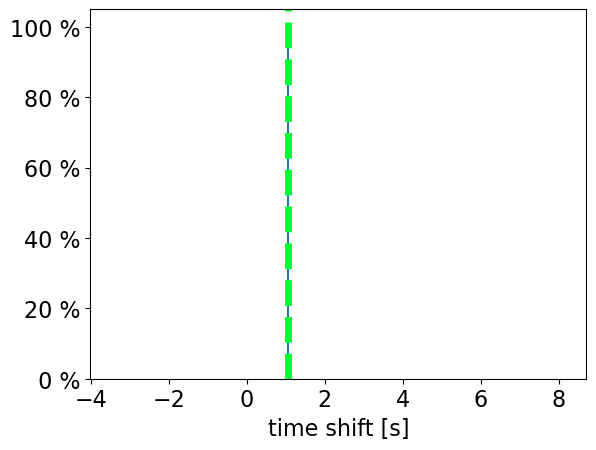
| Time | 2022-11-03 04:50:26 | 1.05 s after origin time |
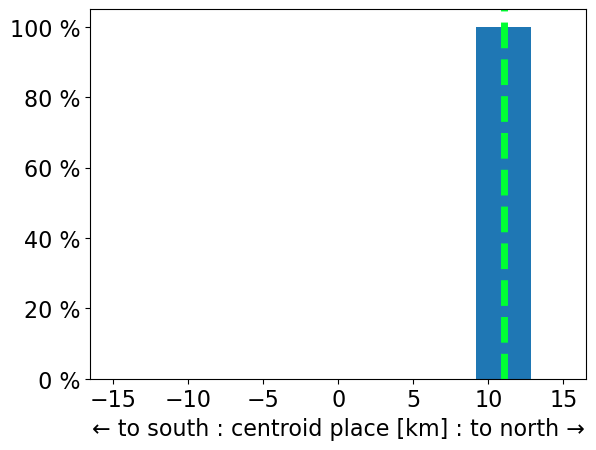
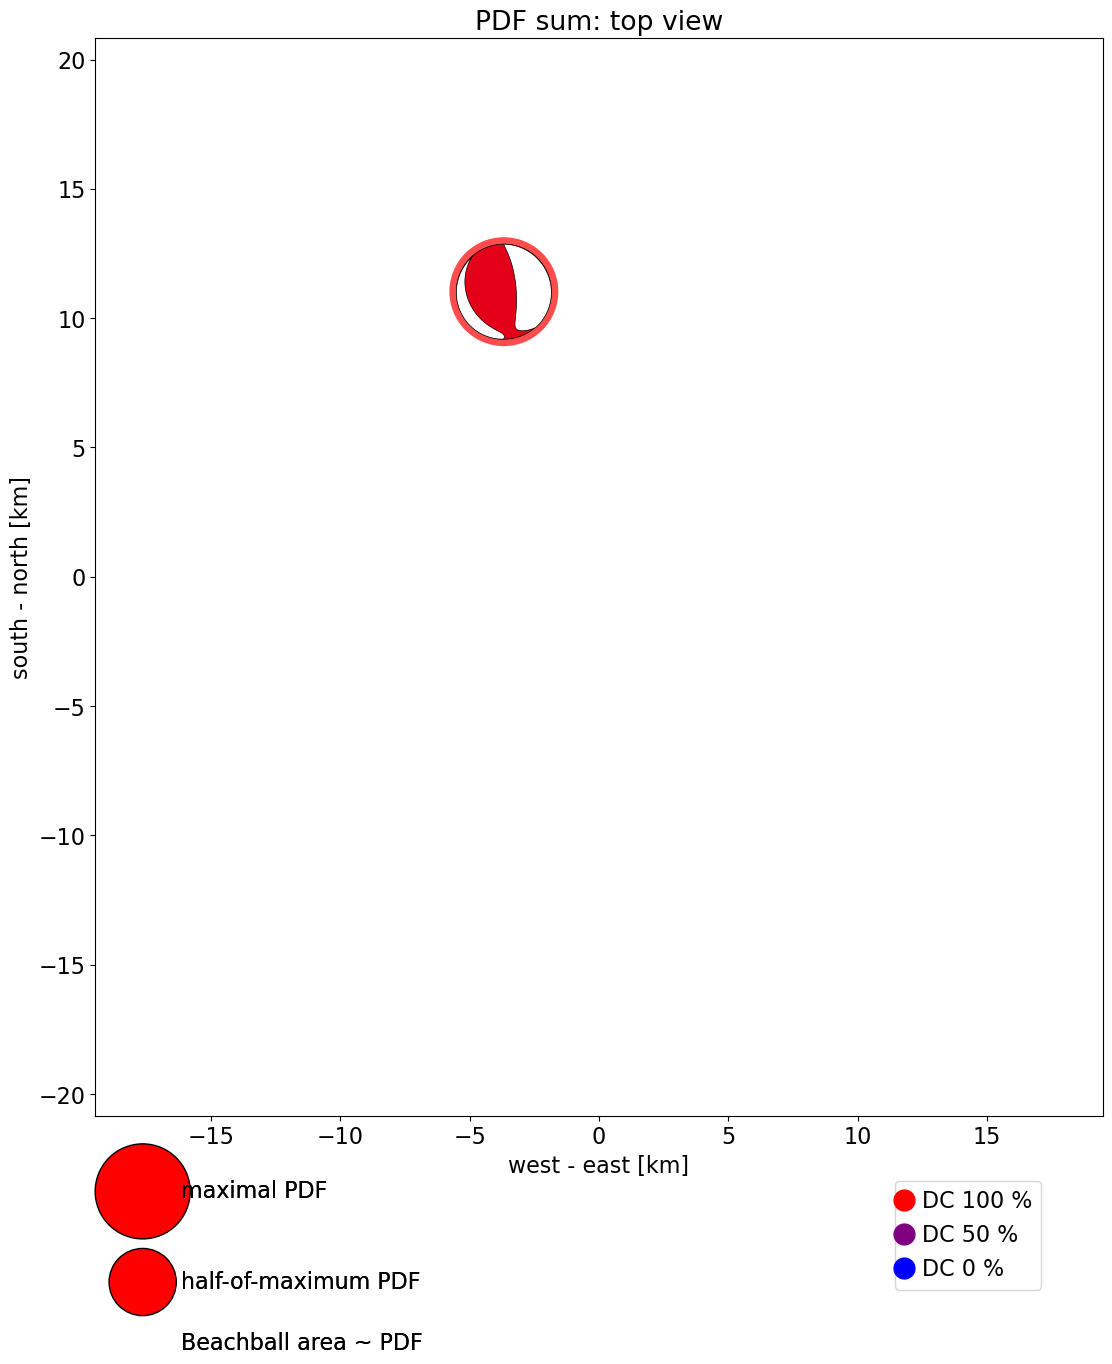
| Latitude | 45.589° N | 11024 m north of the epicenter |
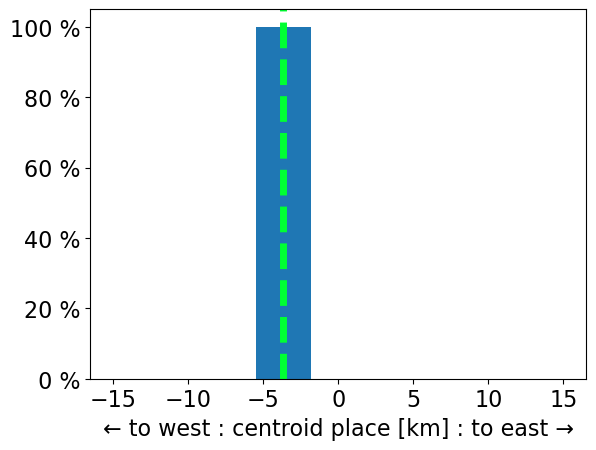
| Longitude | 26.479° E | 3675 m west of the epicenter |
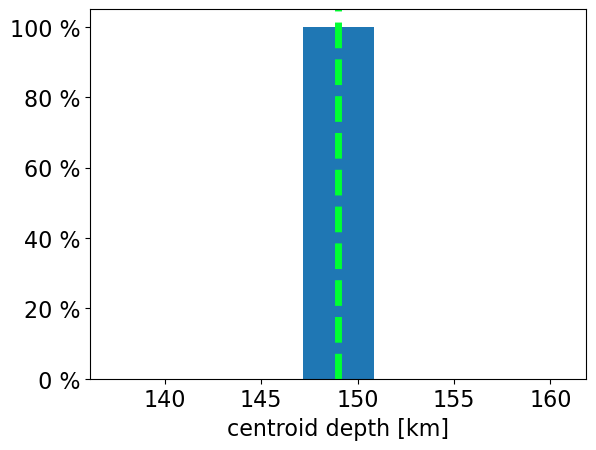
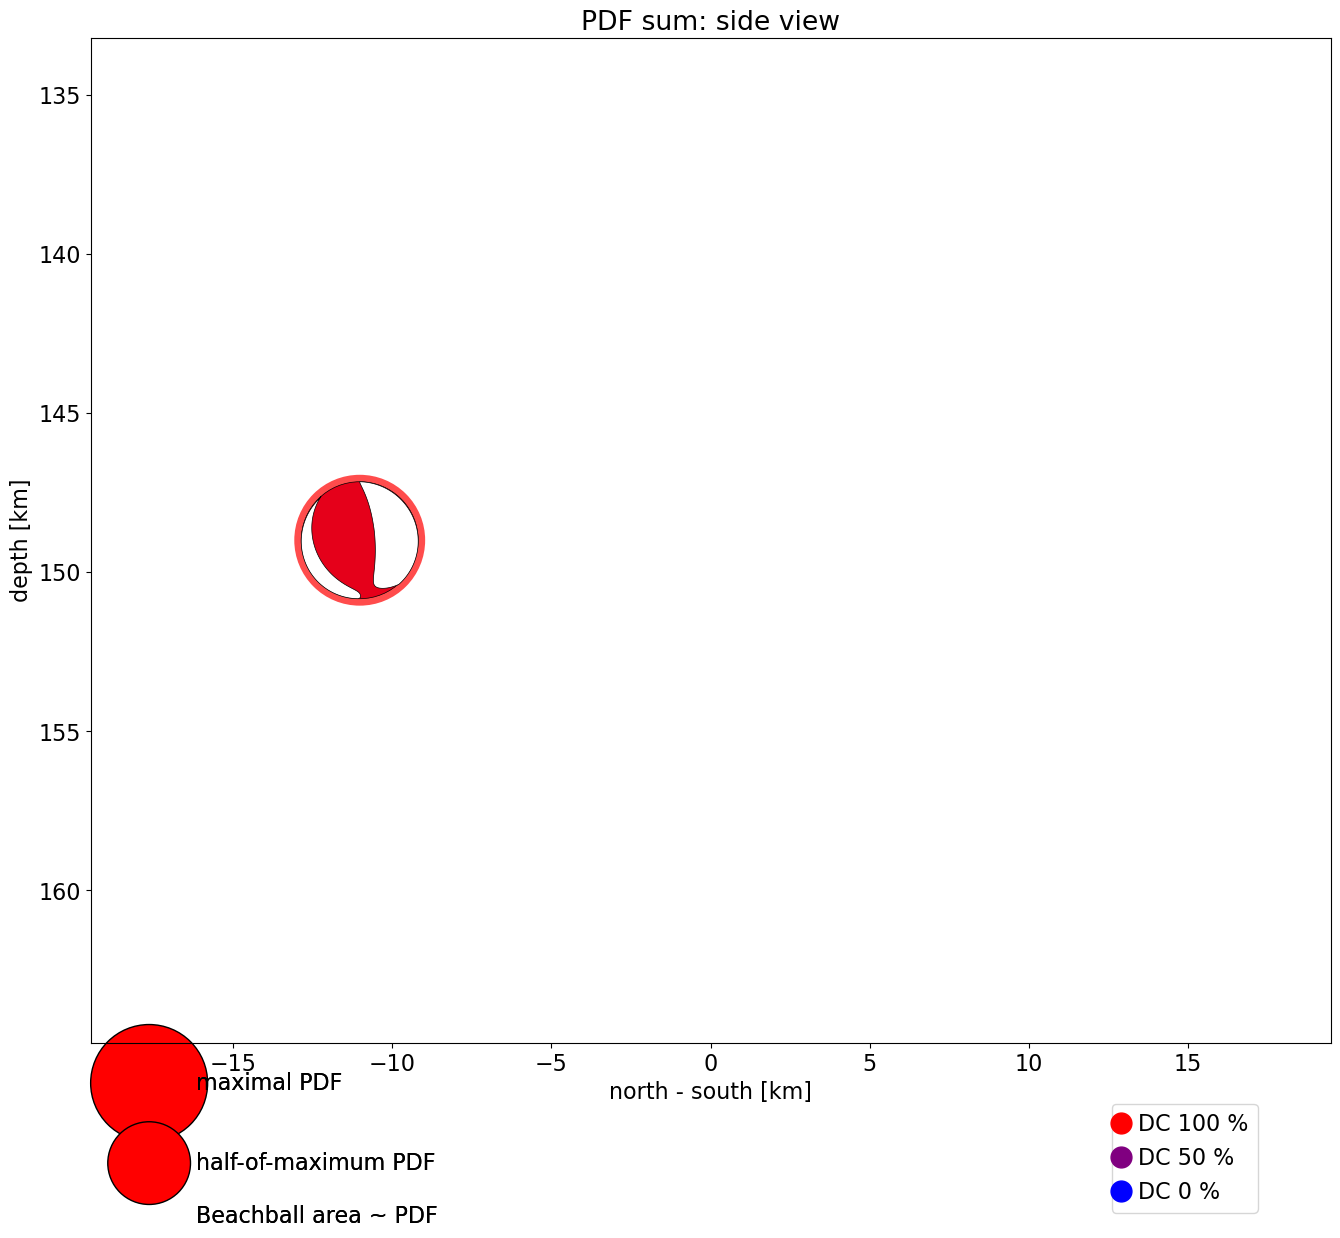
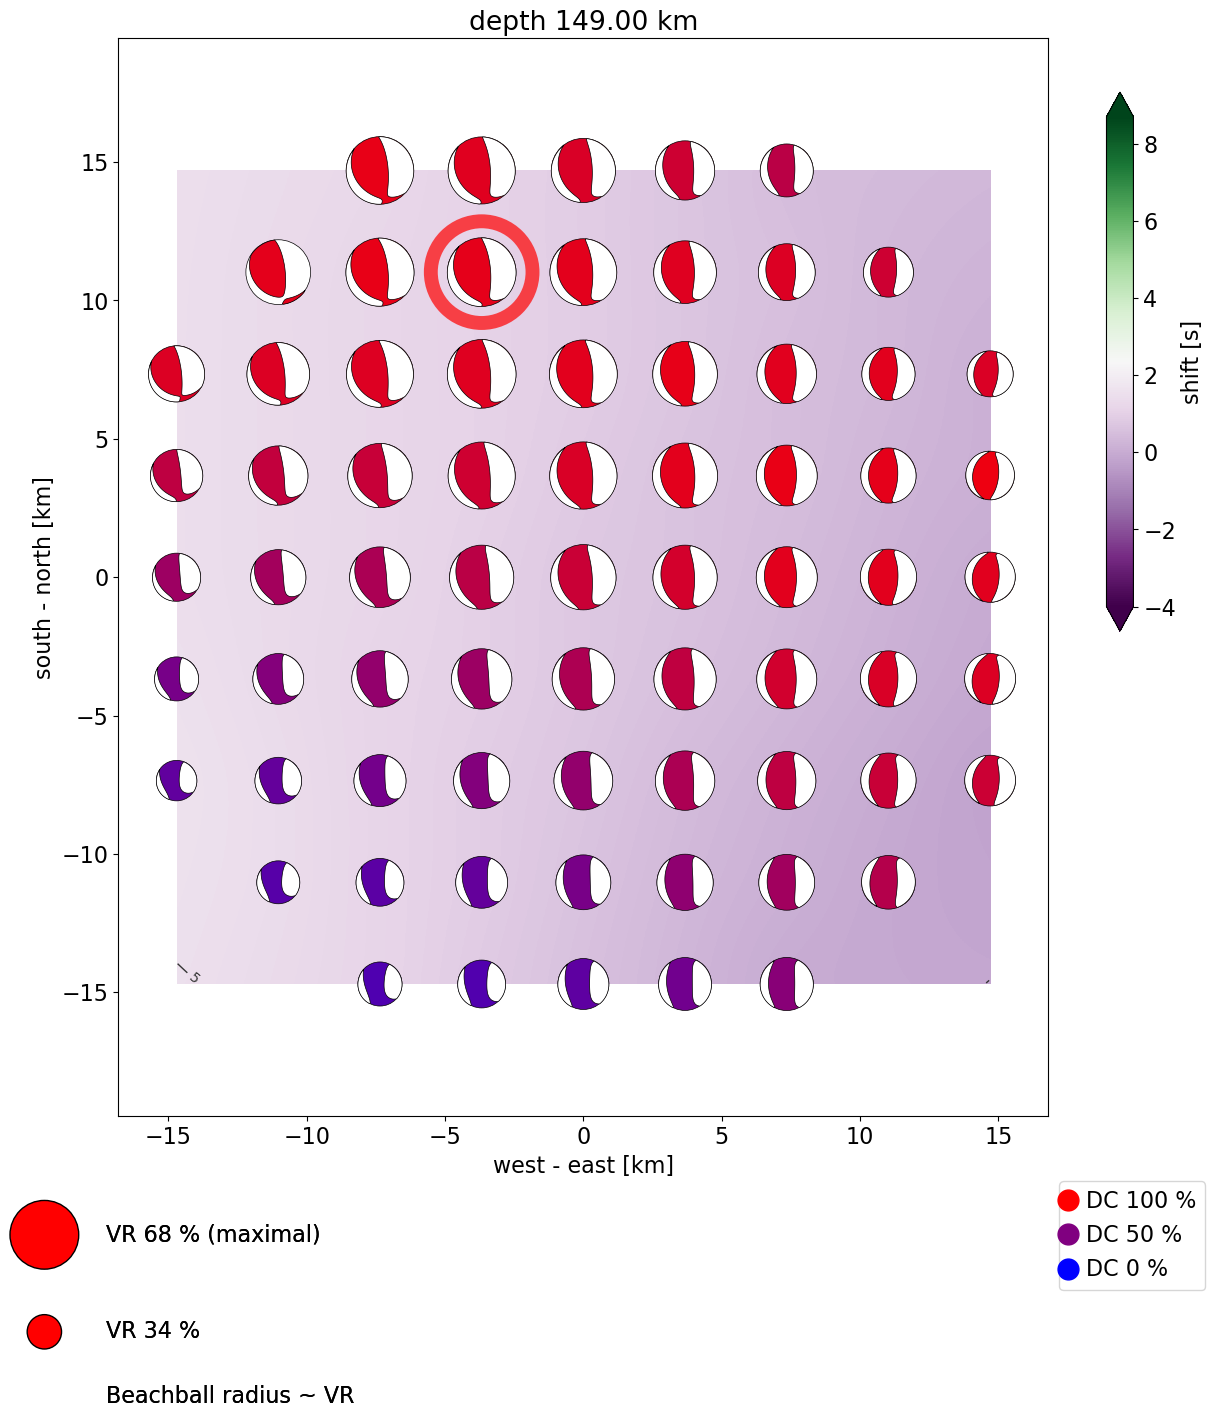
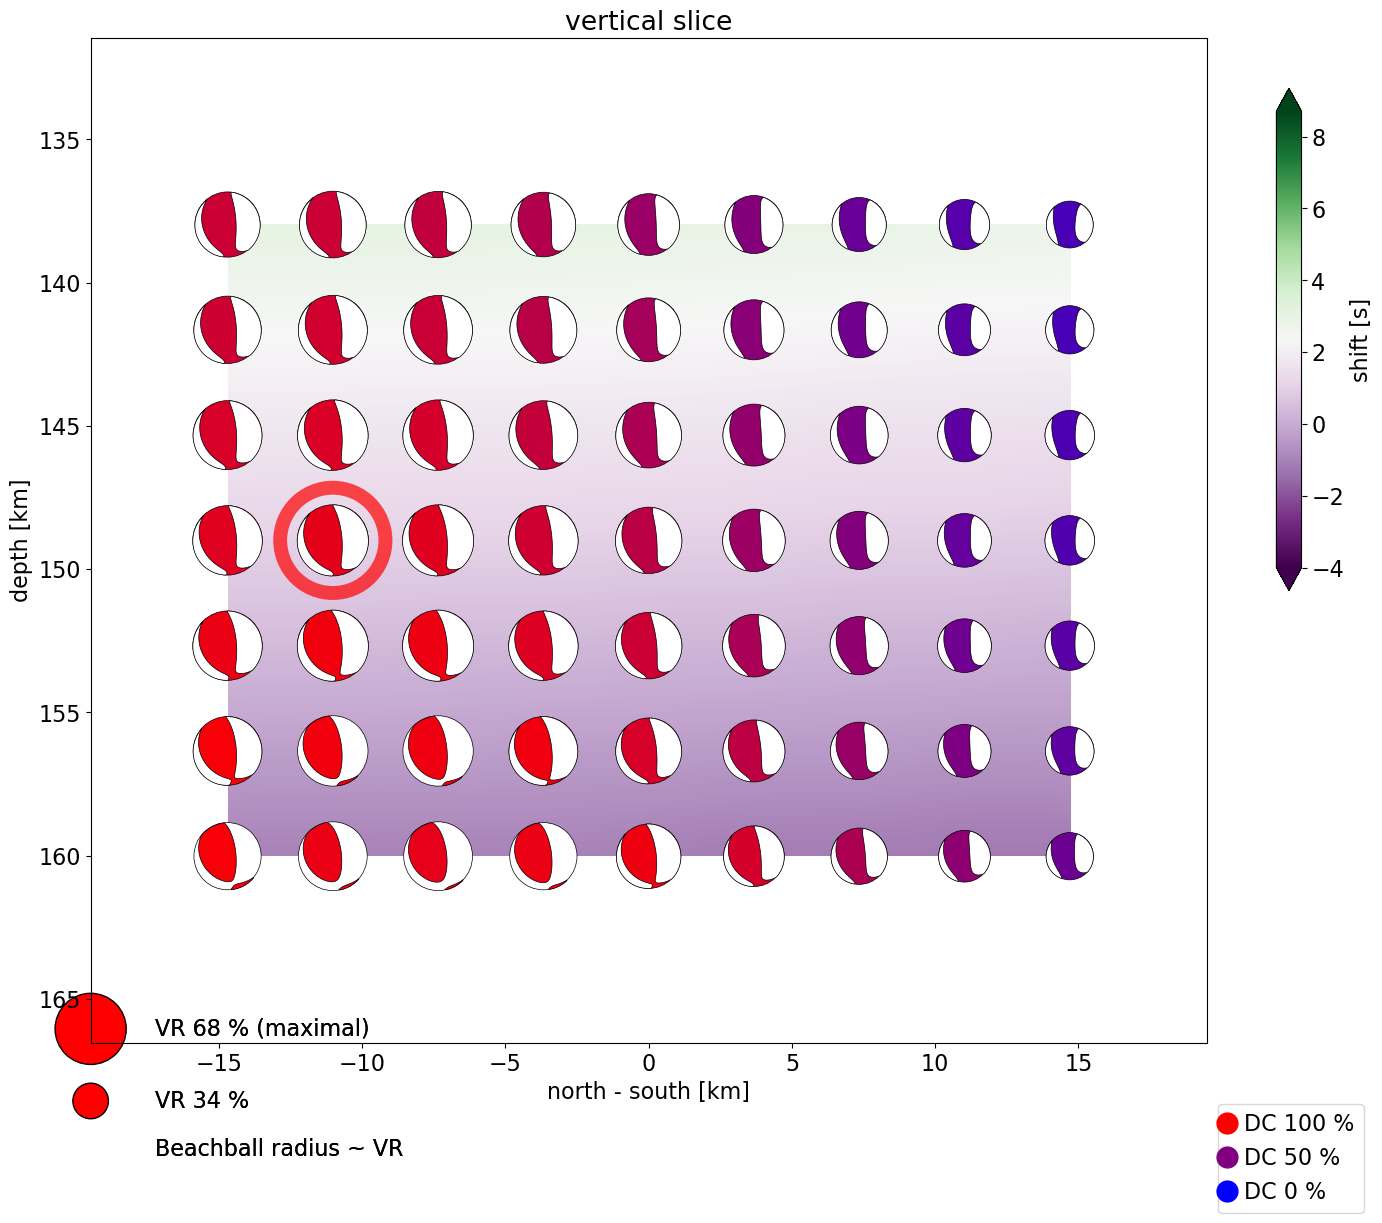
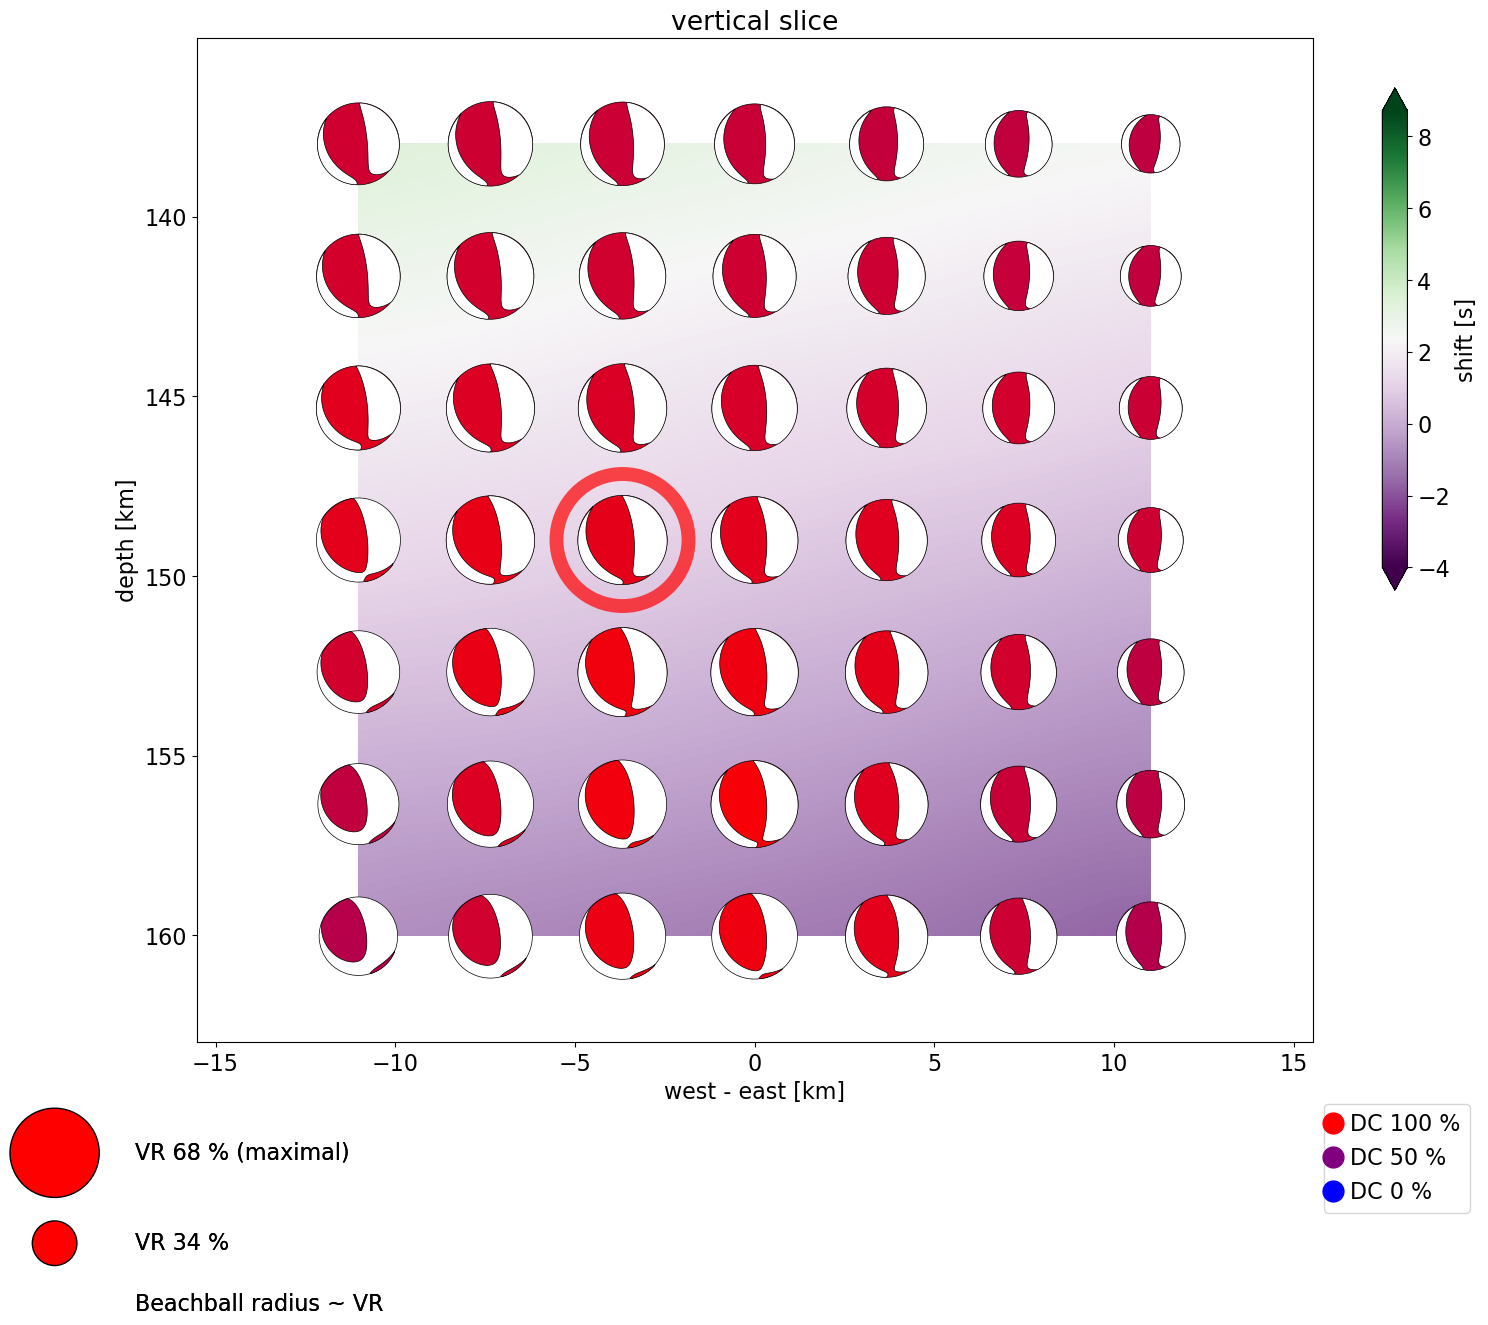
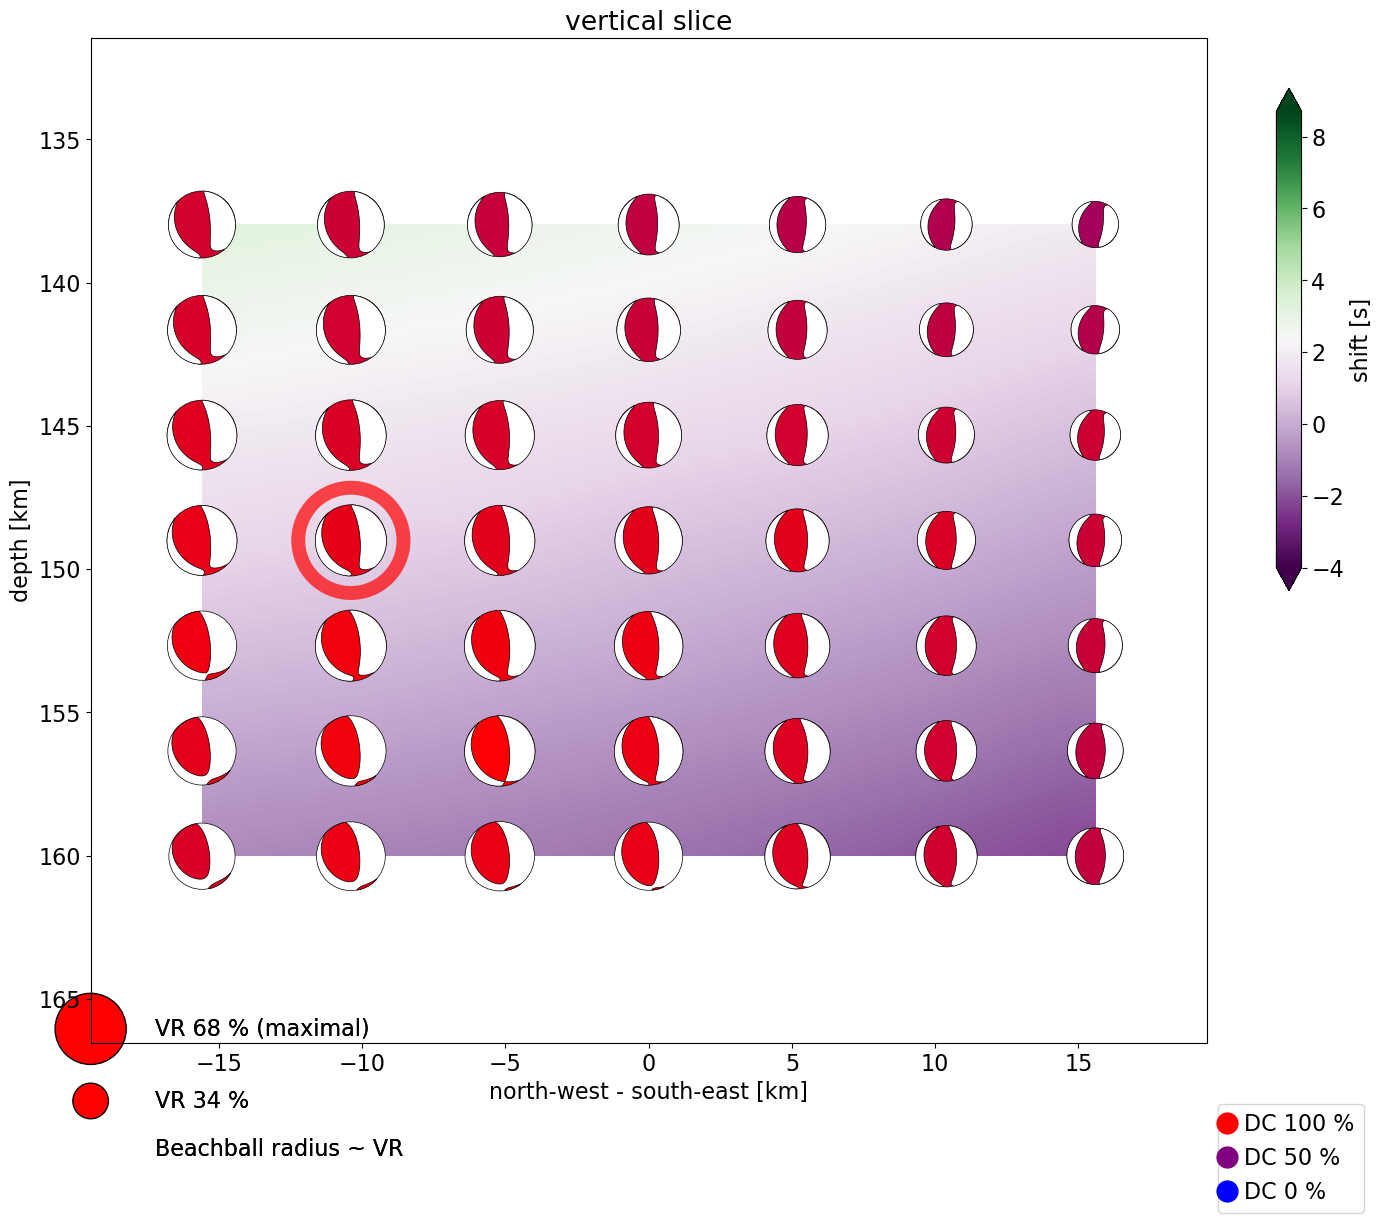
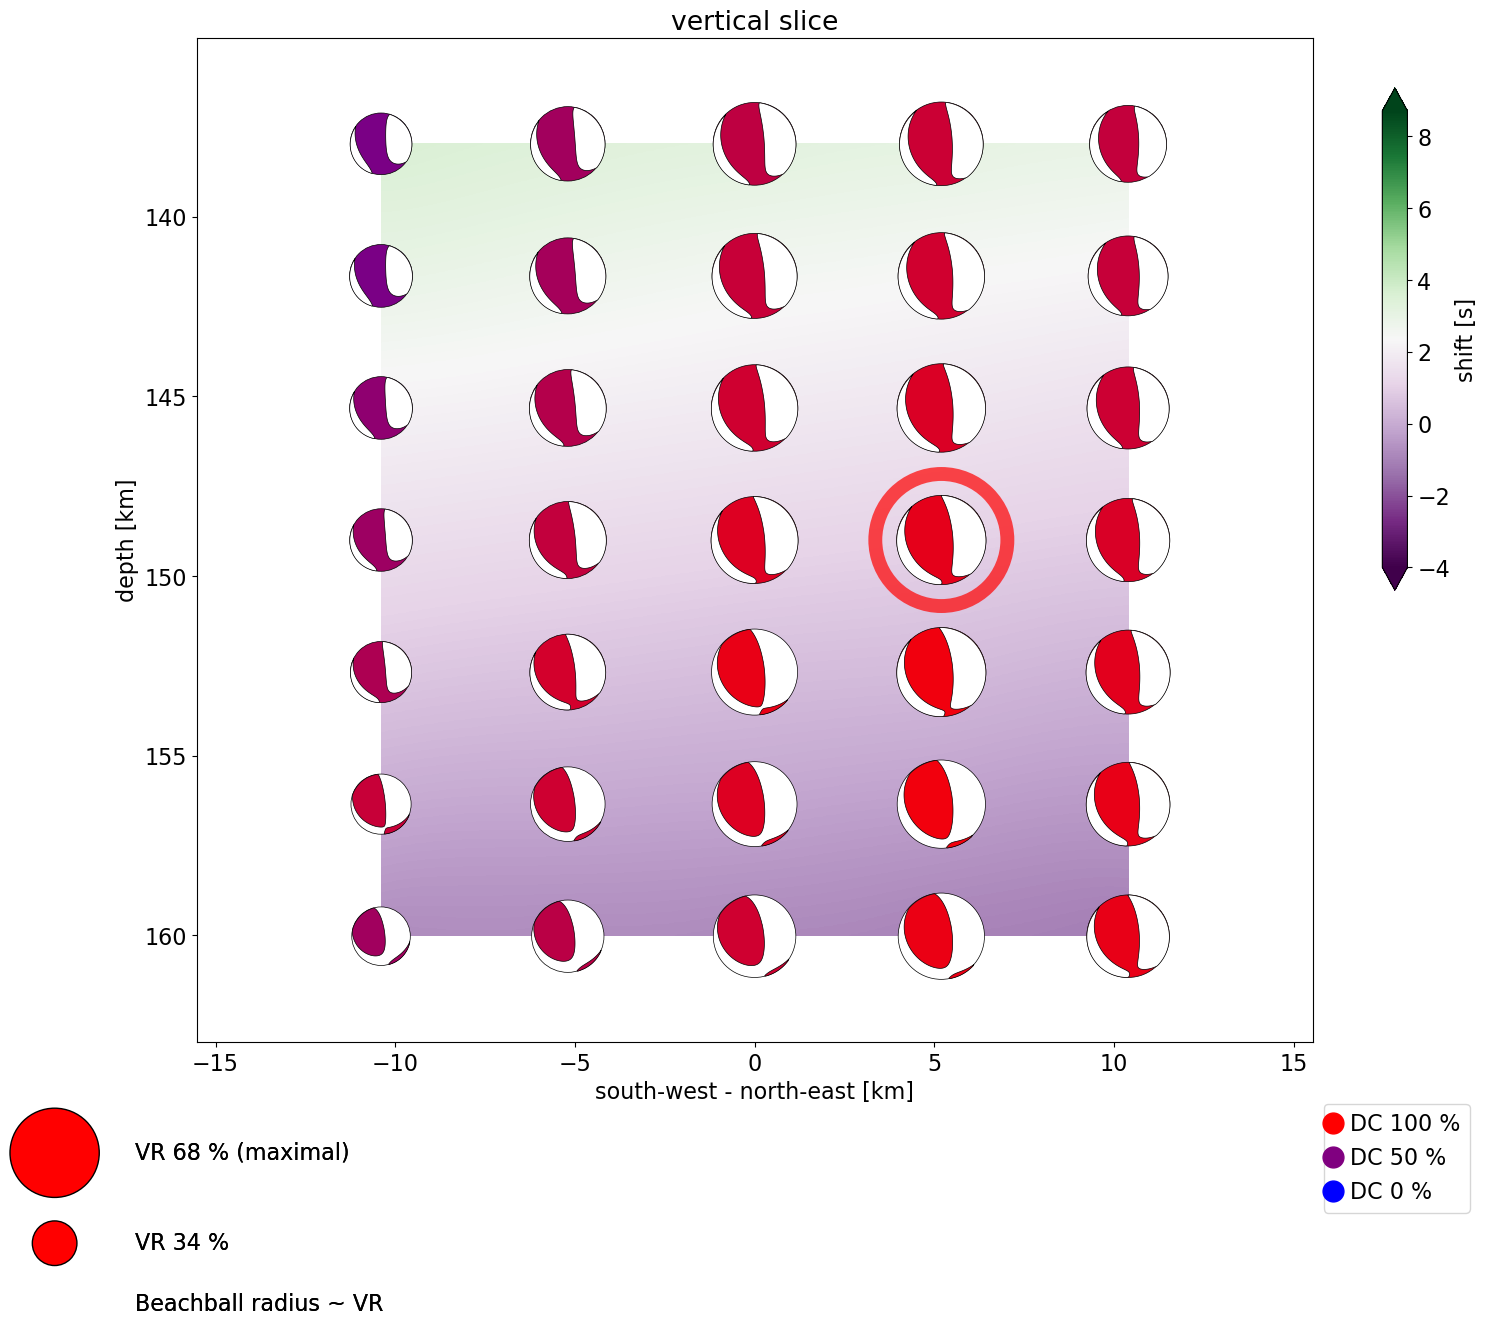
| Depth | 149.0 km | 0.0 km deeper than location |
| Centroid position | |
|---|---|
| depth | 149.0 km |
| Seismic moment | |
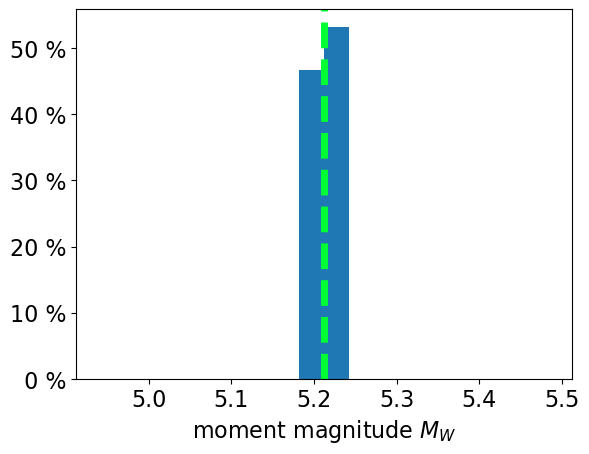
| scalar seismic moment M0 | 7.39e+16 Nm |
| moment magnitude Mw | 5.2 |
| Moment tensor components | |
| Mrr | 4.84 * 1e+16 |
| Mθθ | 0.31 * 1e+16 |
| Mϕϕ | -4.16 * 1e+16 |
| Mrθ | 0.33 * 1e+16 |
| Mrϕ | 4.91 * 1e+16 |
| Mθϕ | 1.99 * 1e+16 |
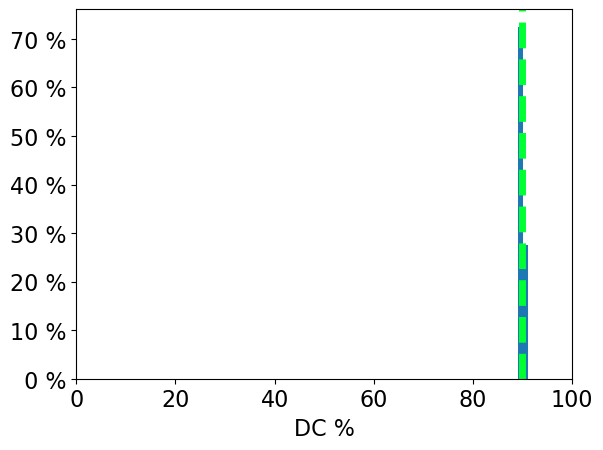
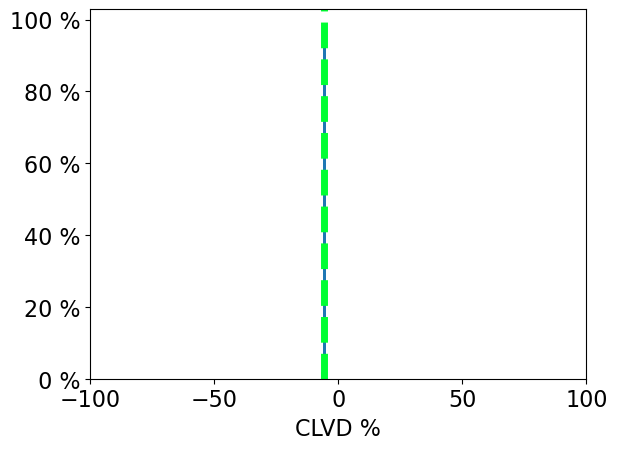
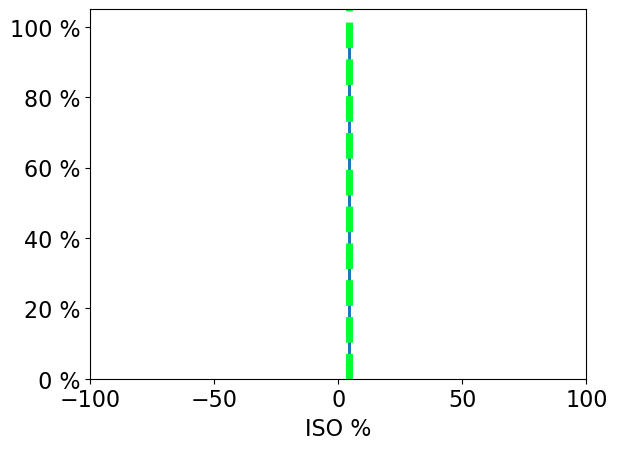
| Moment tensor decomposition | |
| DC | 90 % |
| CLVD | -6 % |
| ISO | 4 % |
| strike | 140 / 357 |
| dip | 26 / 68 |
| rake | 56 / 105 |
| Quality measures | |
| condition number | 4 |
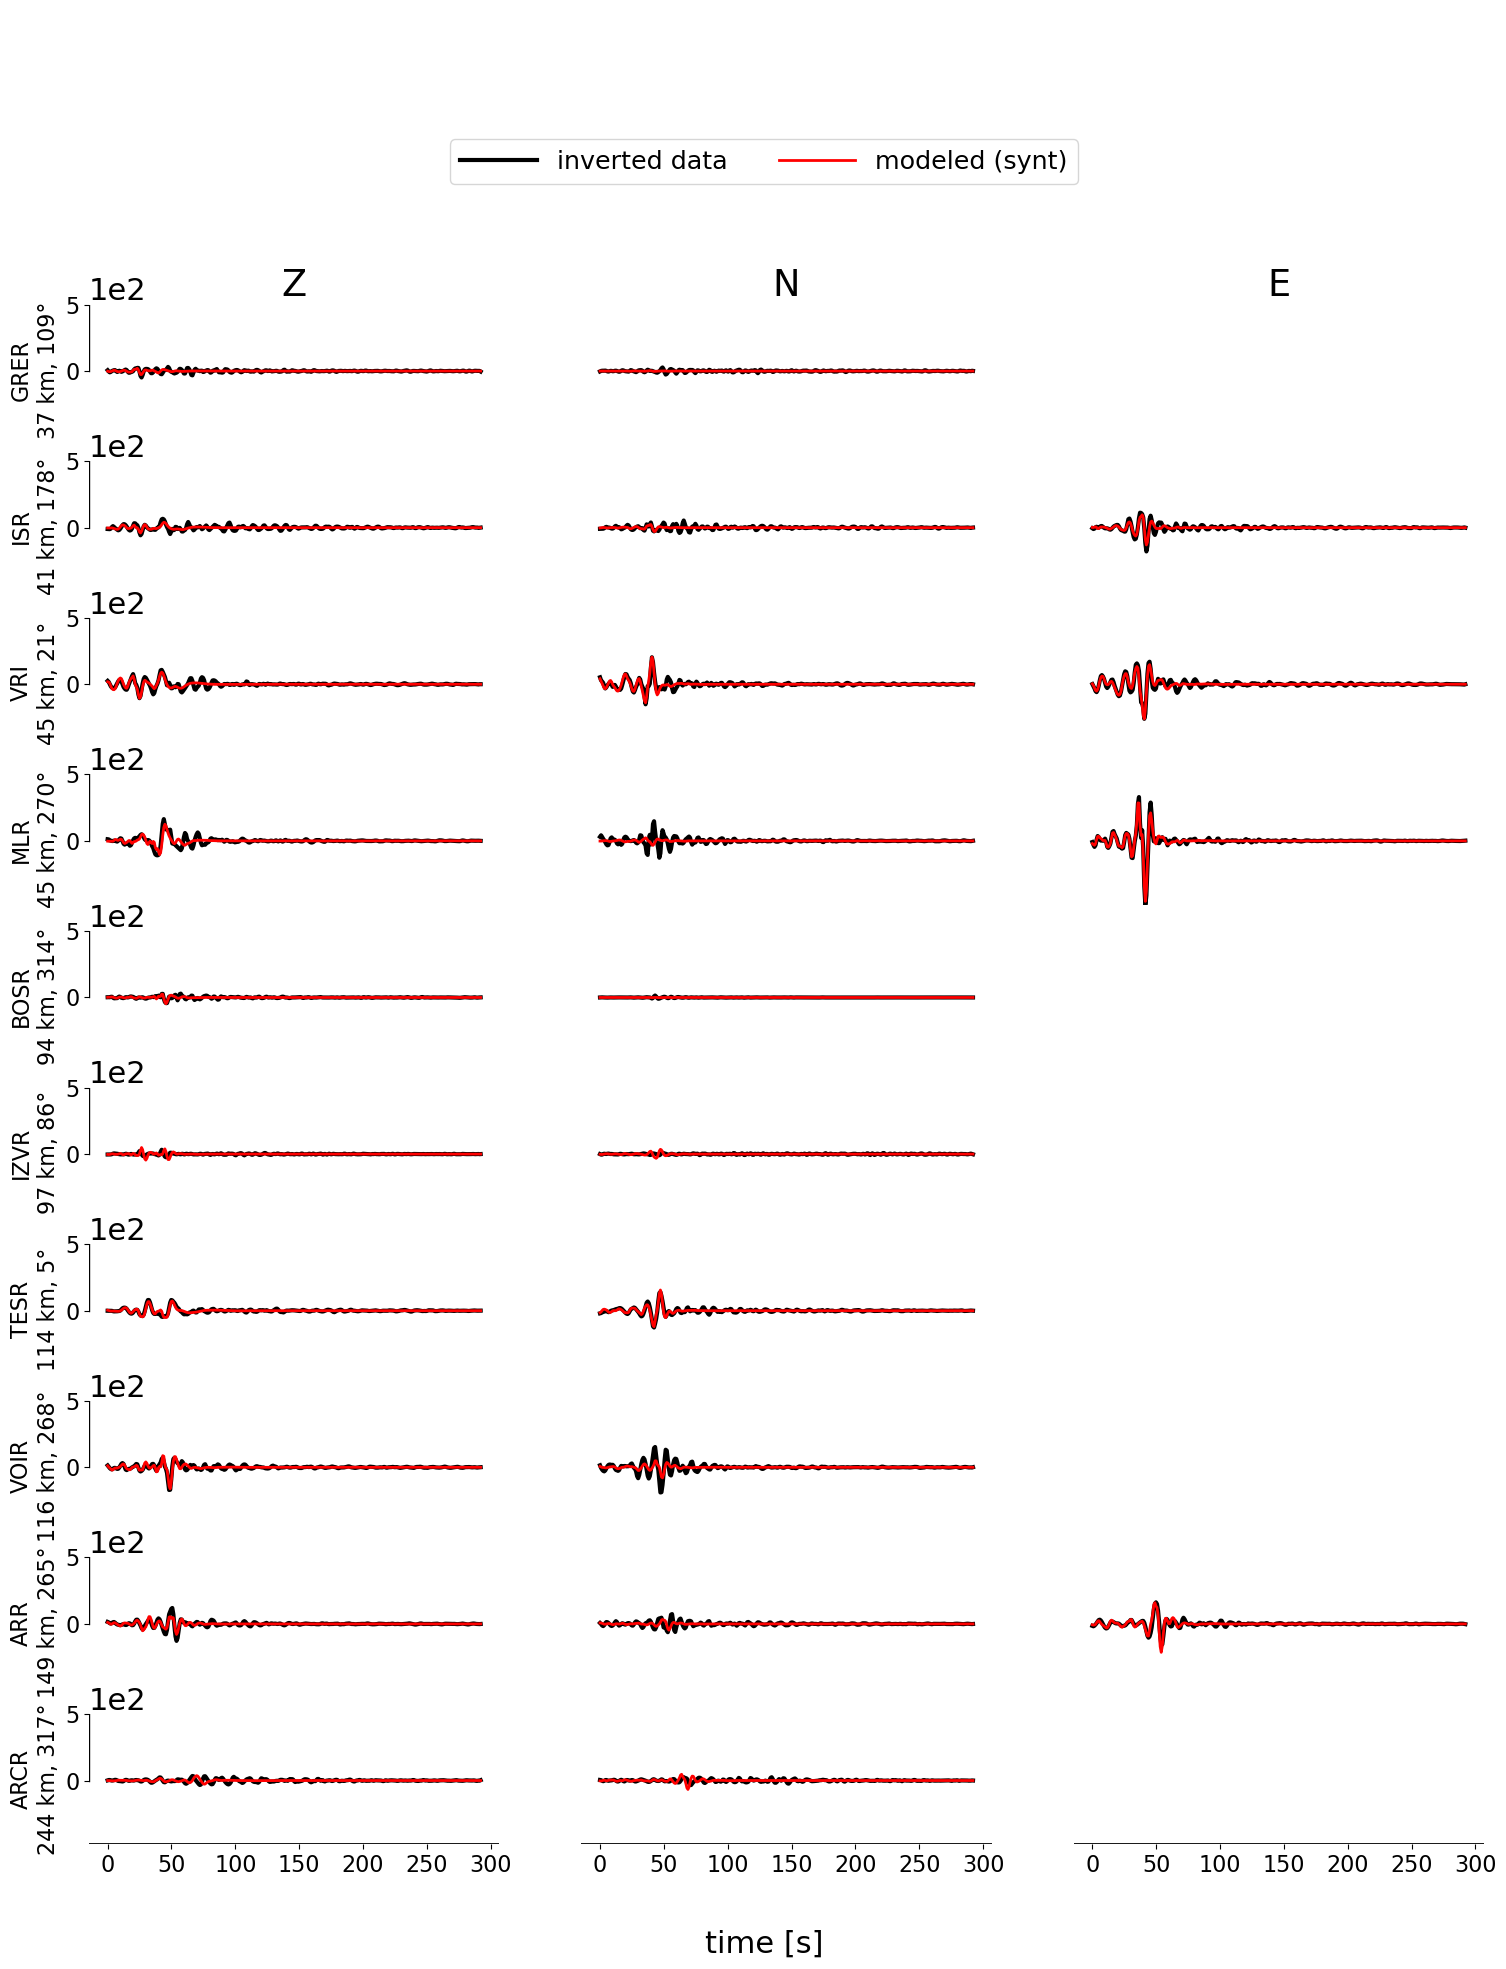
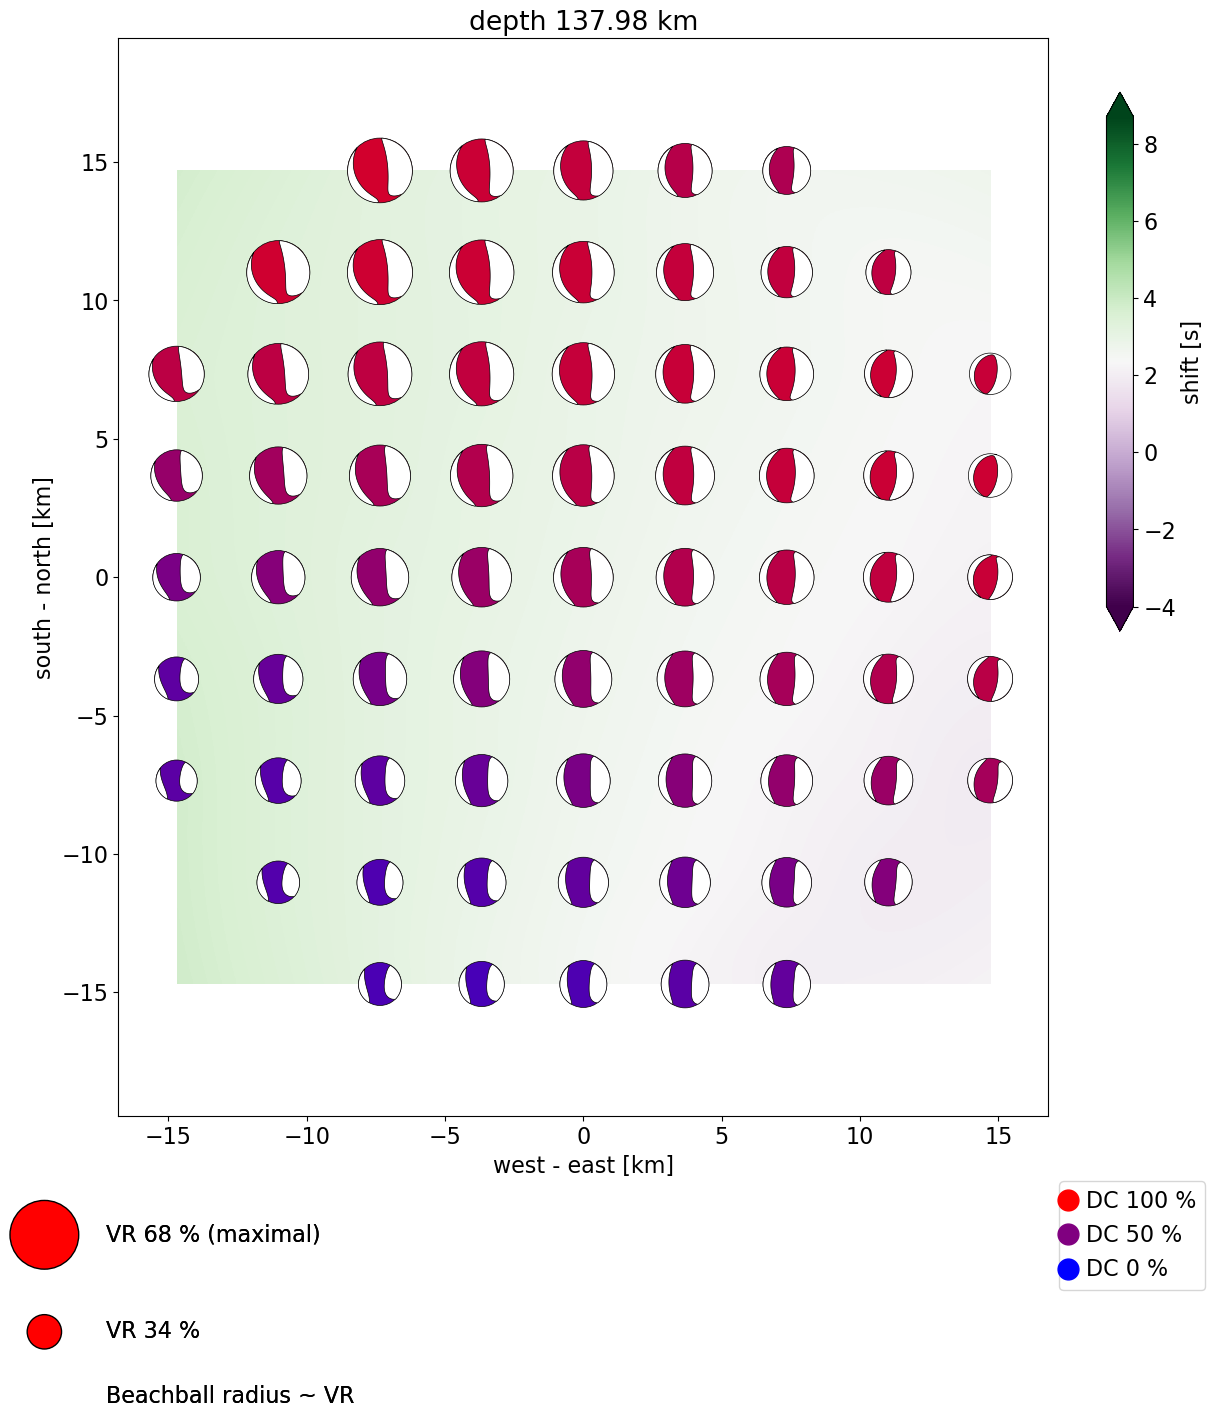
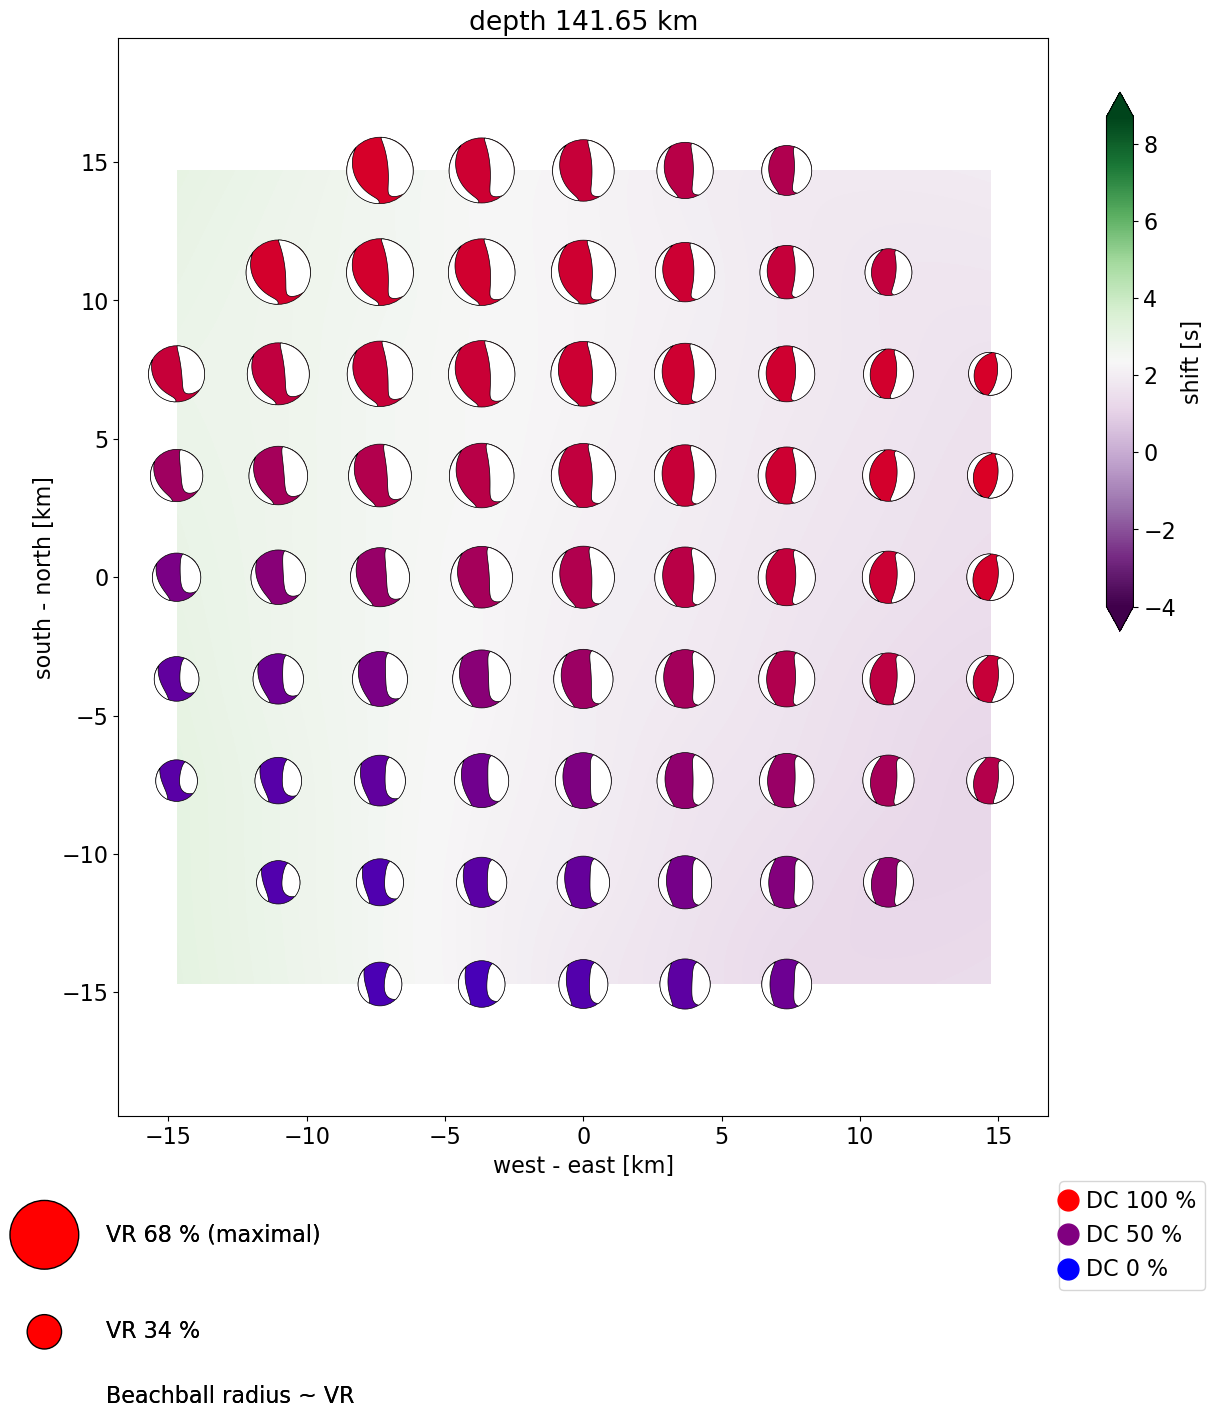
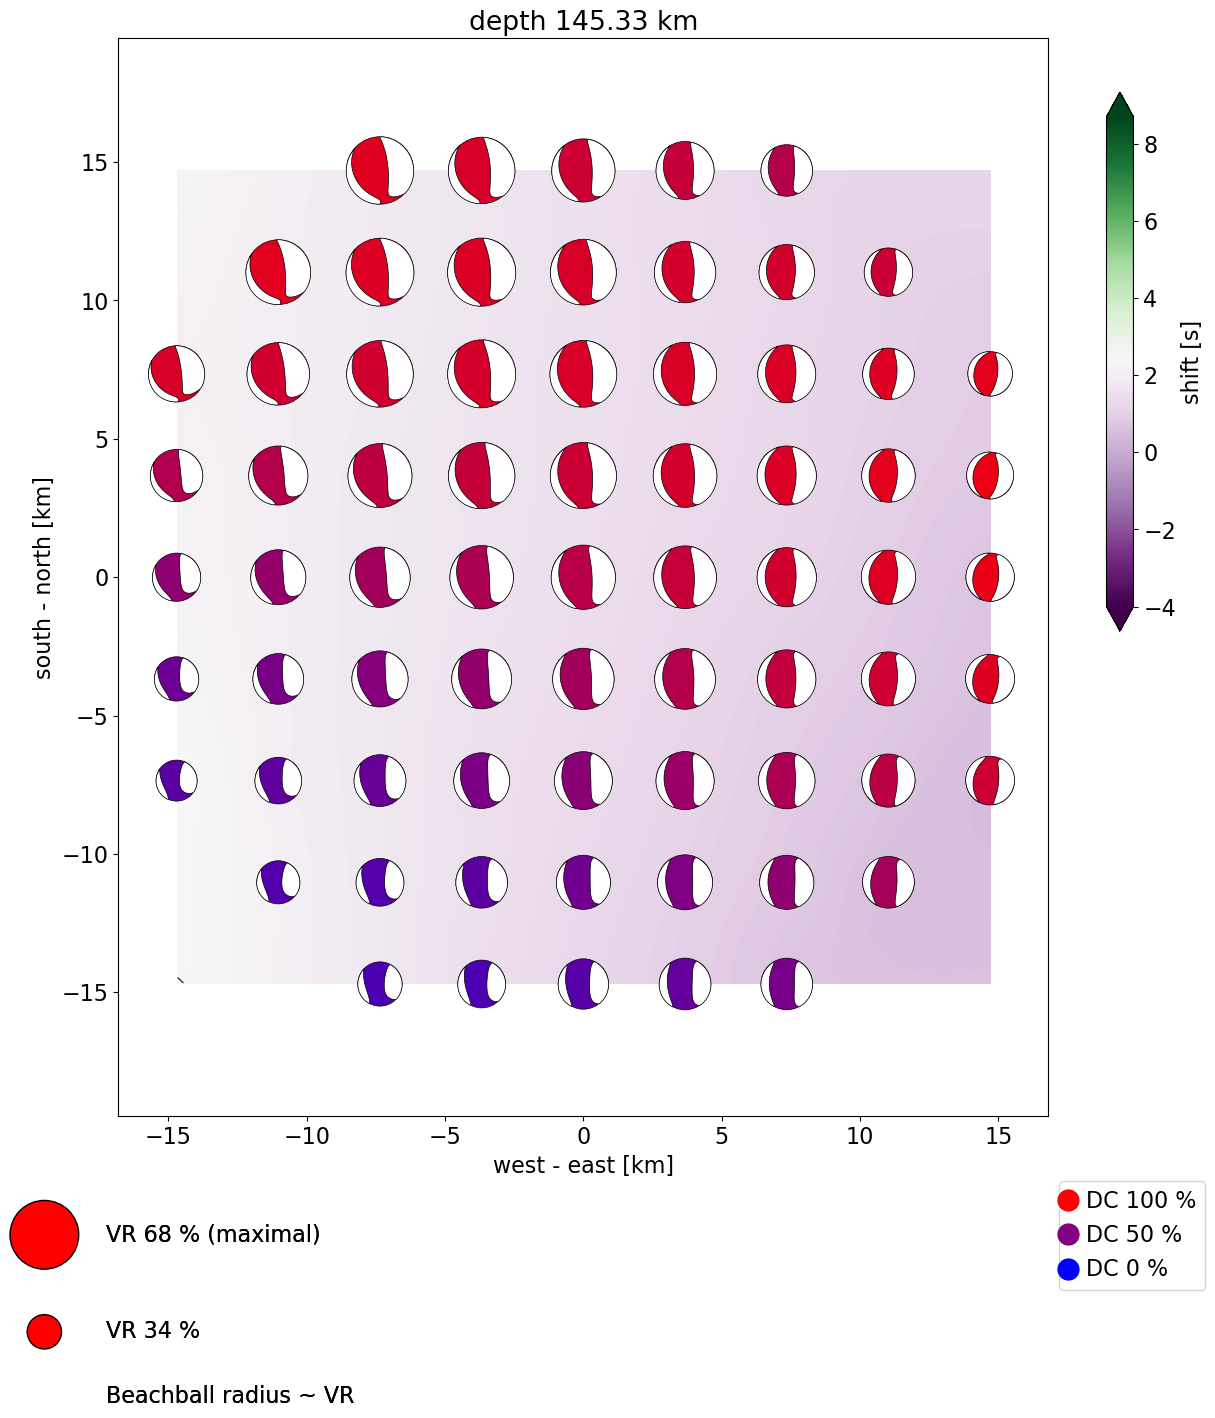
| variance reduction | 68 % |
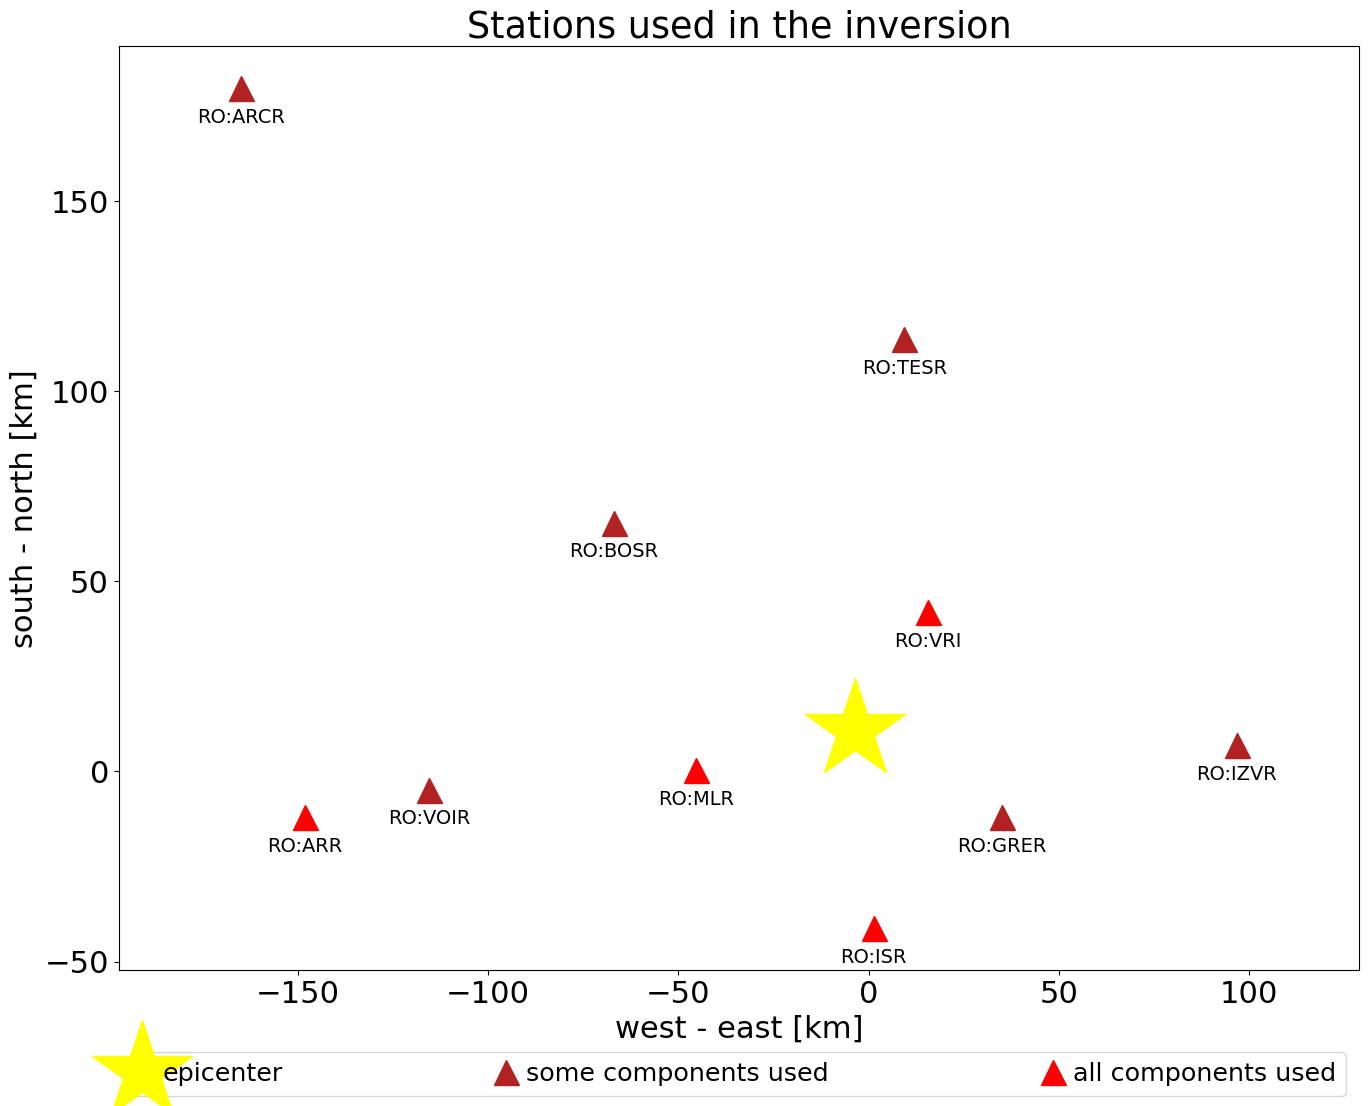
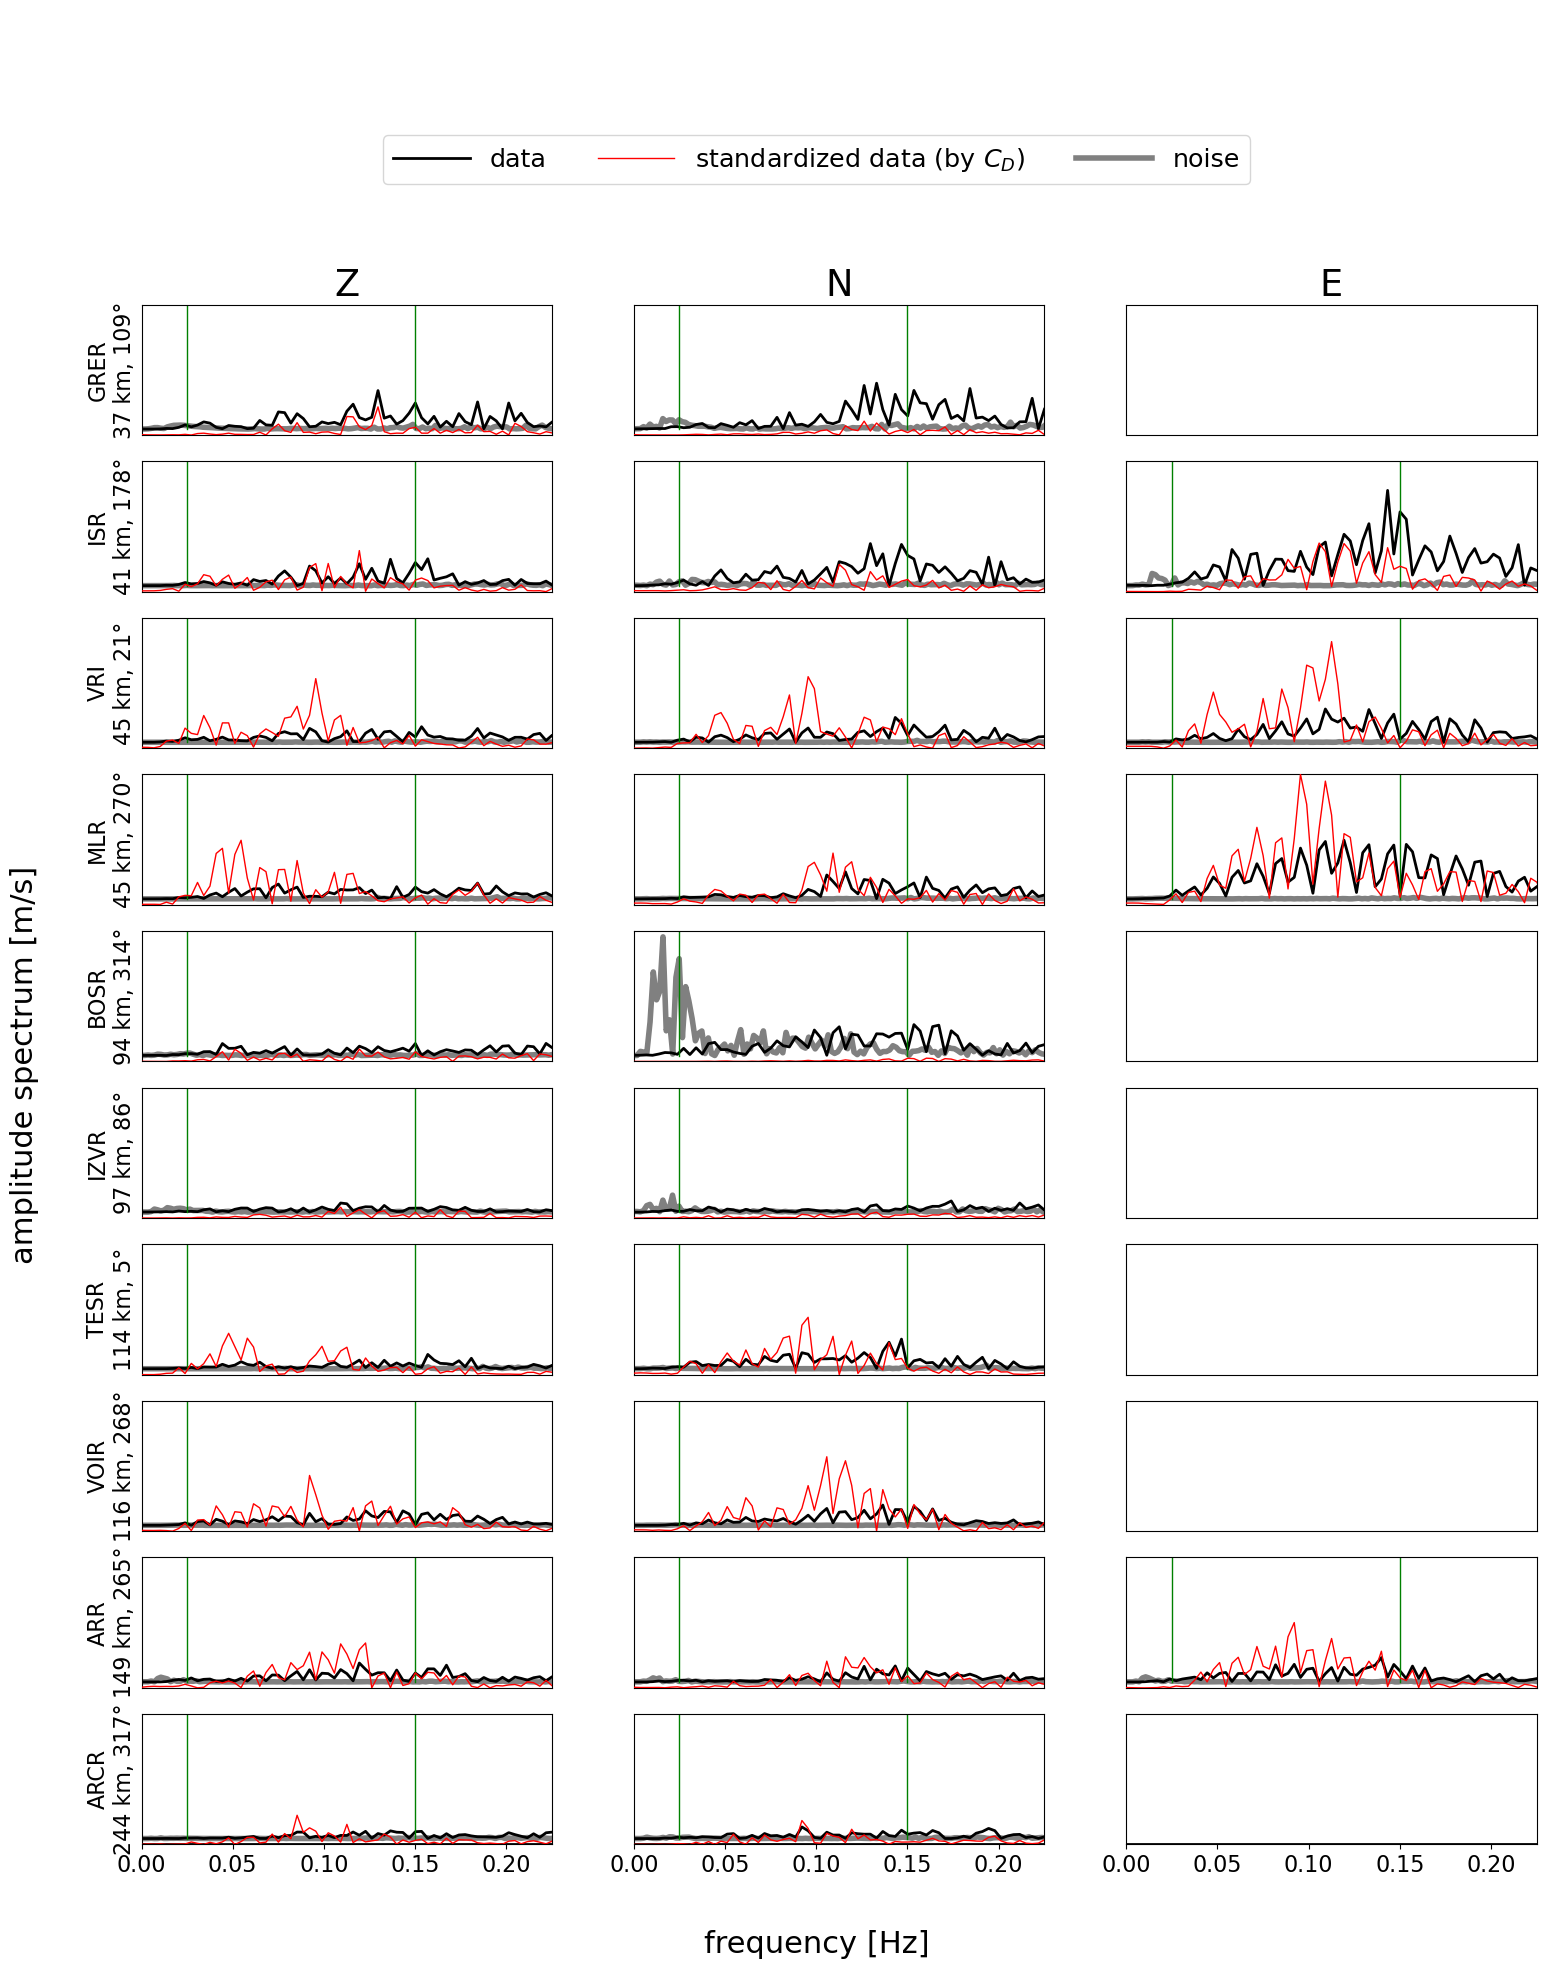
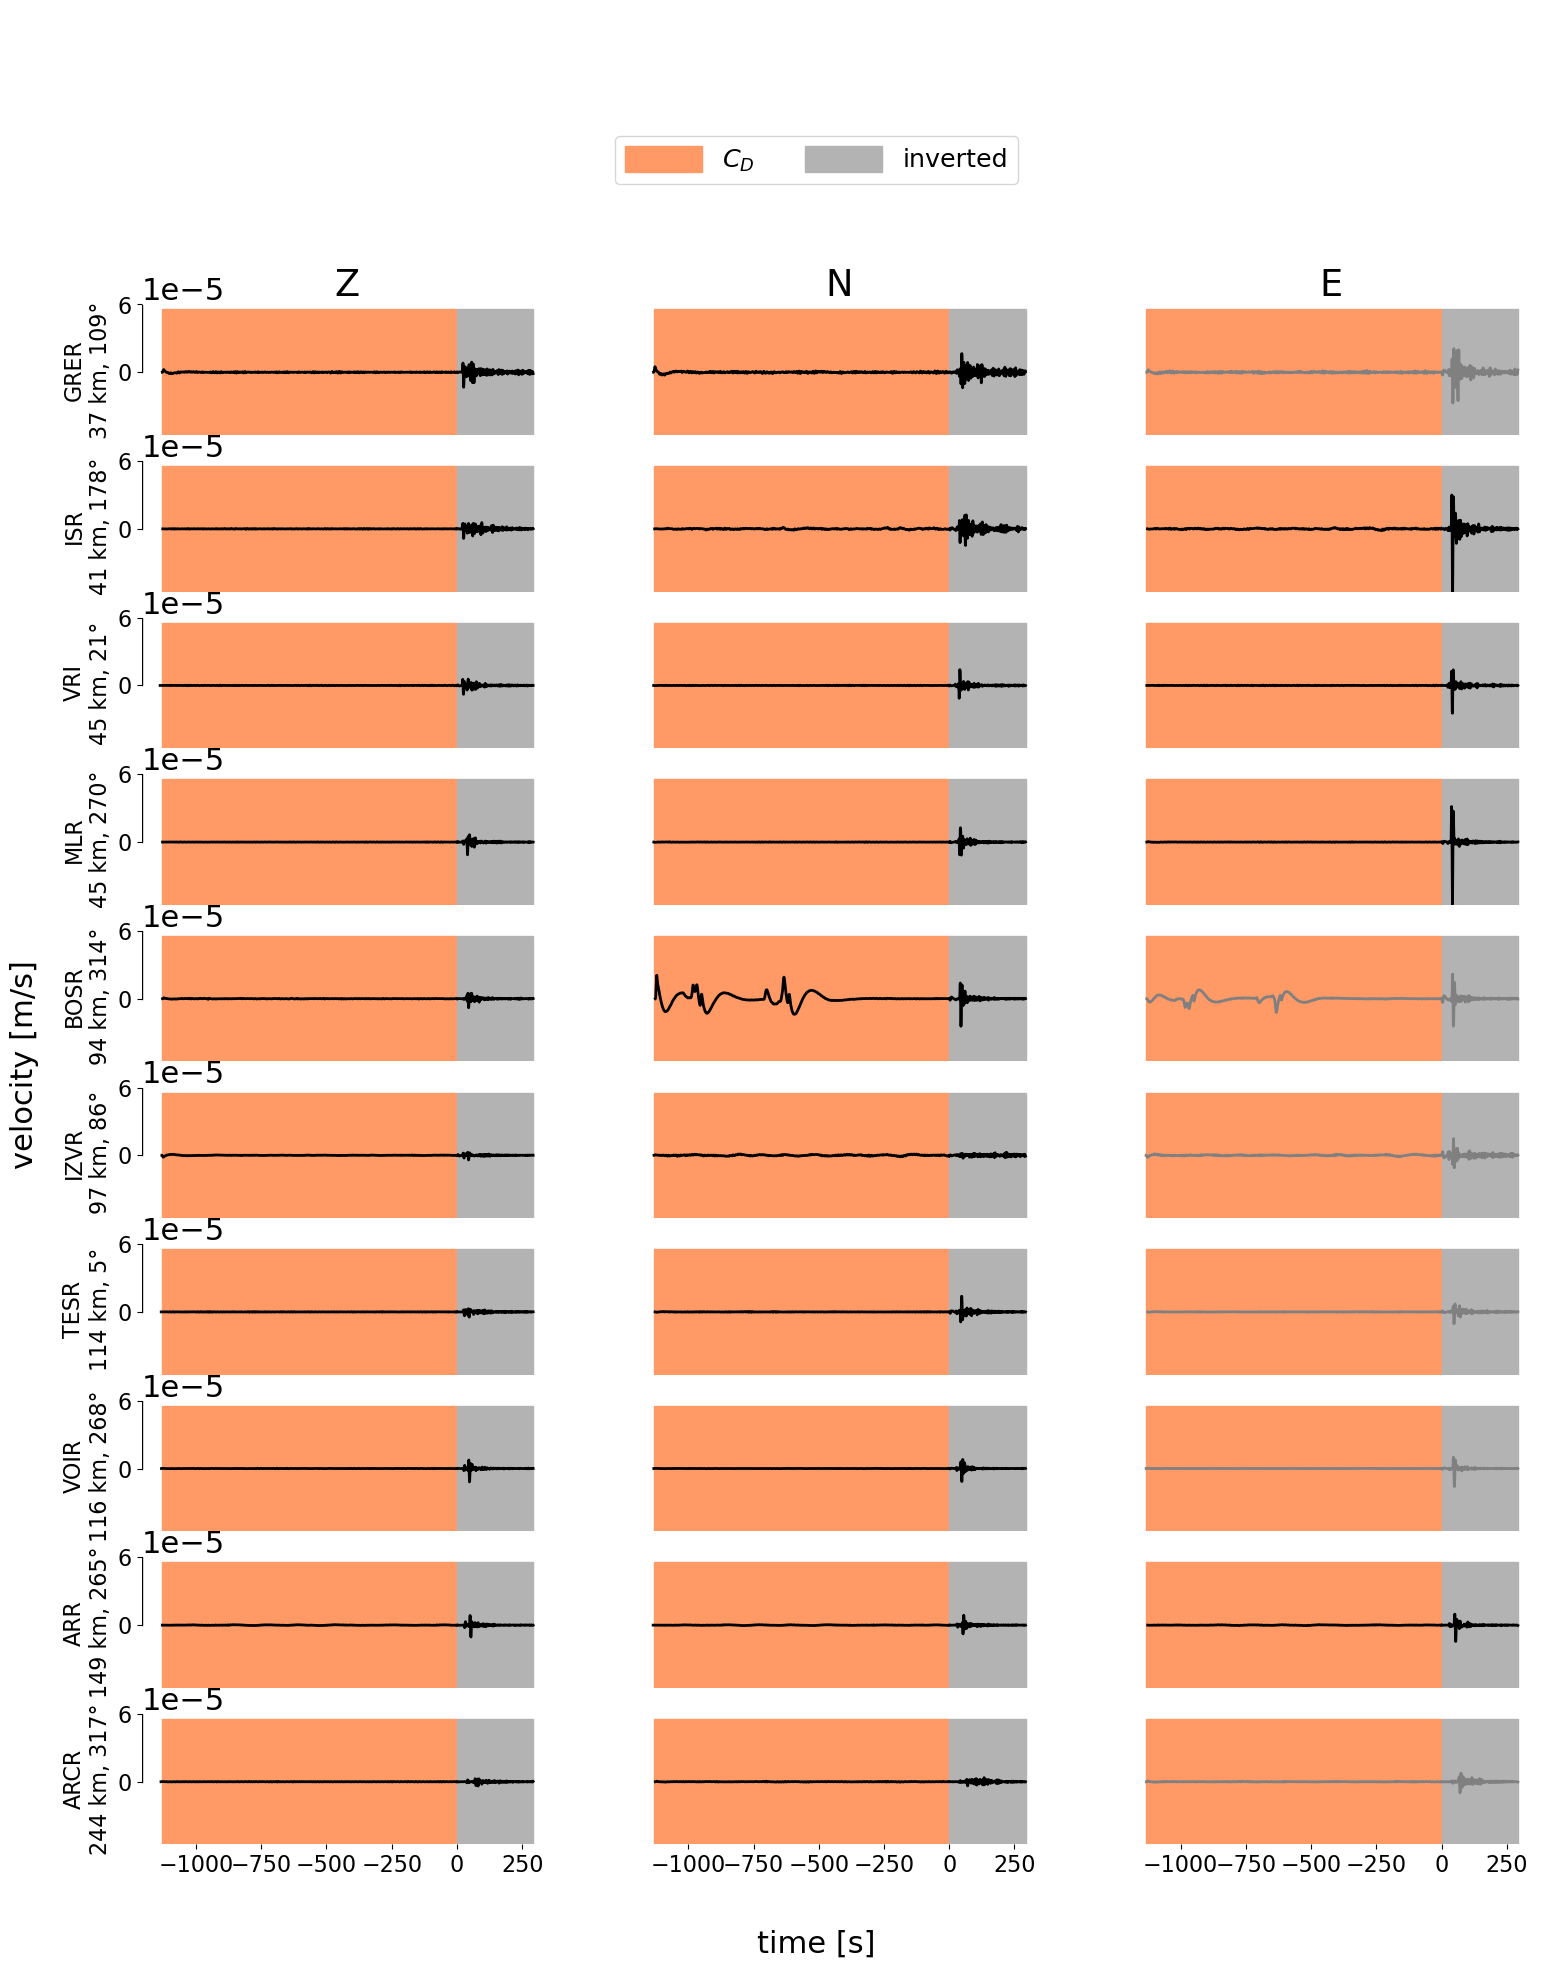
| station | component | distance * | azimuth | fmin | fmax | |||
|---|---|---|---|---|---|---|---|---|
| code | channel | Z | N | E | (km) | (deg) | (Hz) | (Hz) |
| RO:GRER | HH | 1.0 | 1.0 | --- | 37 | 109 | 0.03 | 0.15 |
| RO:ISR | HH | 1.0 | 1.0 | 1.0 | 41 | 178 | 0.03 | 0.15 |
| RO:VRI | HH | 1.0 | 1.0 | 1.0 | 45 | 21 | 0.03 | 0.15 |
| RO:MLR | HH | 1.0 | 1.0 | 1.0 | 45 | 270 | 0.03 | 0.15 |
| RO:BOSR | HH | 1.0 | 1.0 | --- | 94 | 314 | 0.03 | 0.15 |
| RO:IZVR | HH | 1.0 | 1.0 | --- | 97 | 86 | 0.03 | 0.15 |
| RO:TESR | HH | 1.0 | 1.0 | --- | 114 | 5 | 0.03 | 0.15 |
| RO:VOIR | HH | 1.0 | 1.0 | --- | 116 | 268 | 0.03 | 0.15 |
| RO:ARR | HH | 1.0 | 1.0 | 1.0 | 149 | 265 | 0.03 | 0.15 |
| RO:ARCR | HH | 1.0 | 1.0 | --- | 244 | 317 | 0.03 | 0.15 |
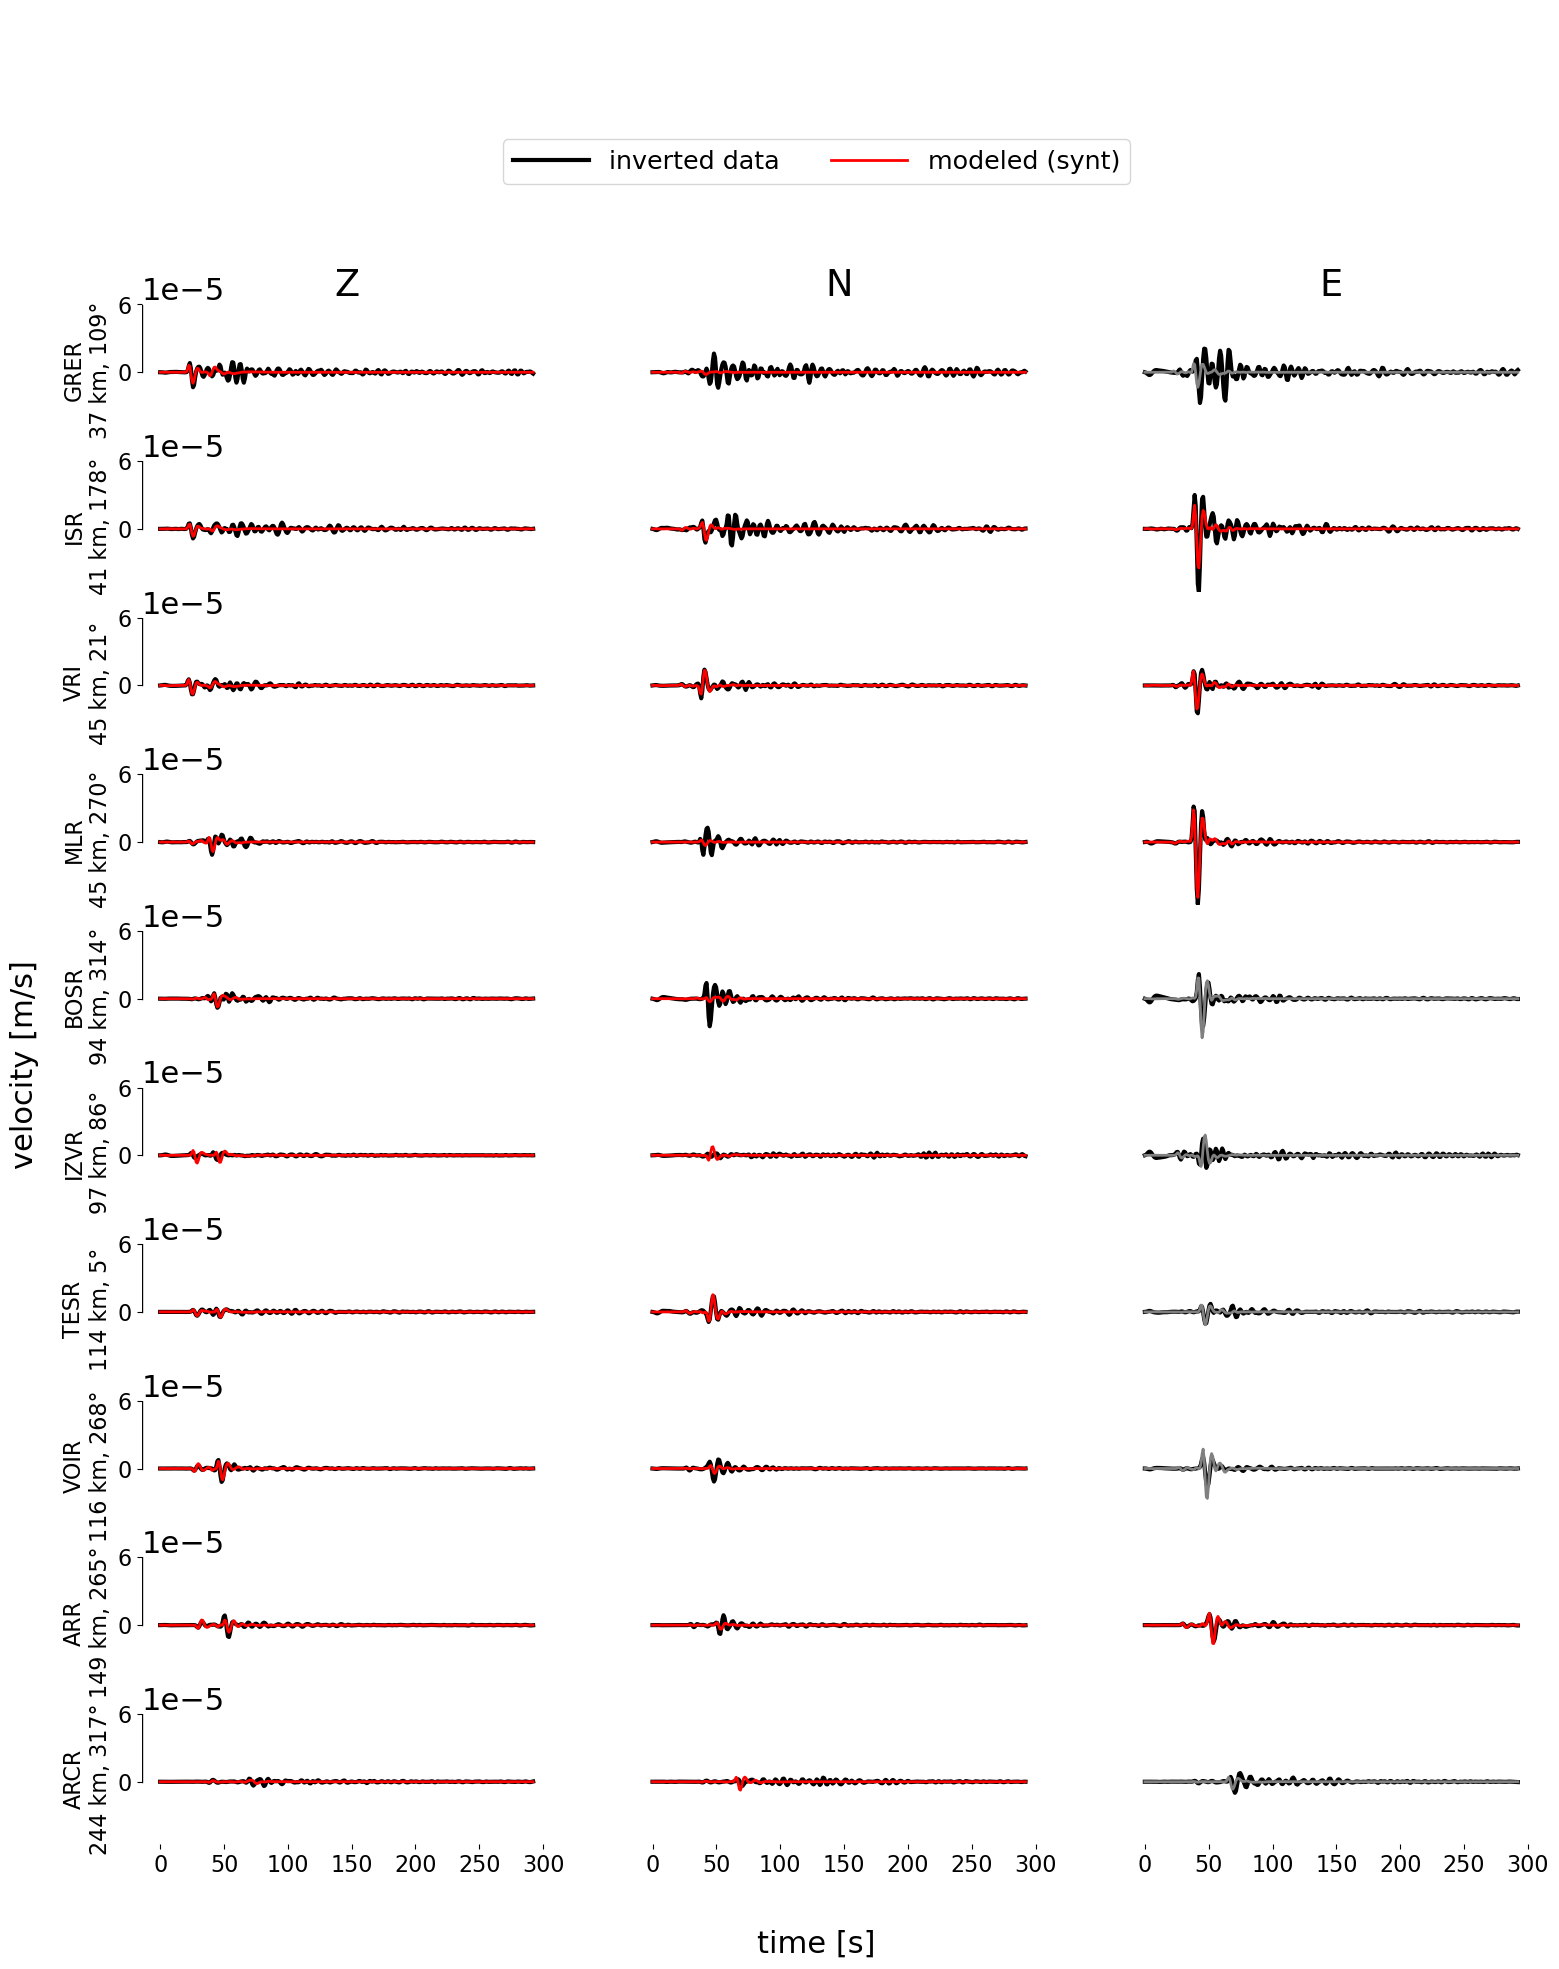
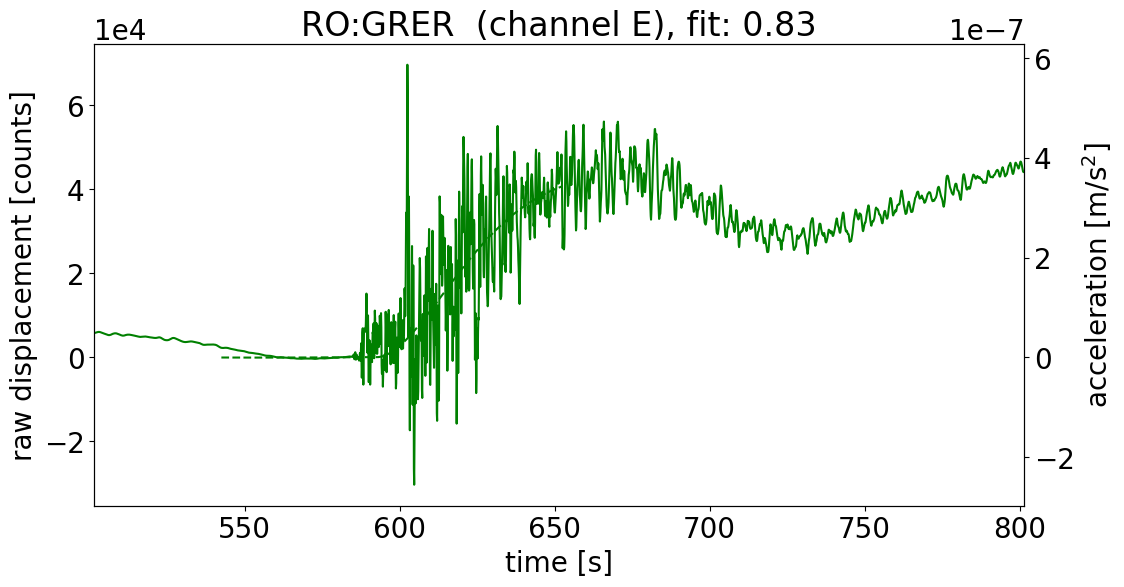
GRER HHE: MOUSE detected, ignoring component in inversion (time of onset: 31.0 s, amplitude: 3.61e-07 m s^-2, fit: 0.83)
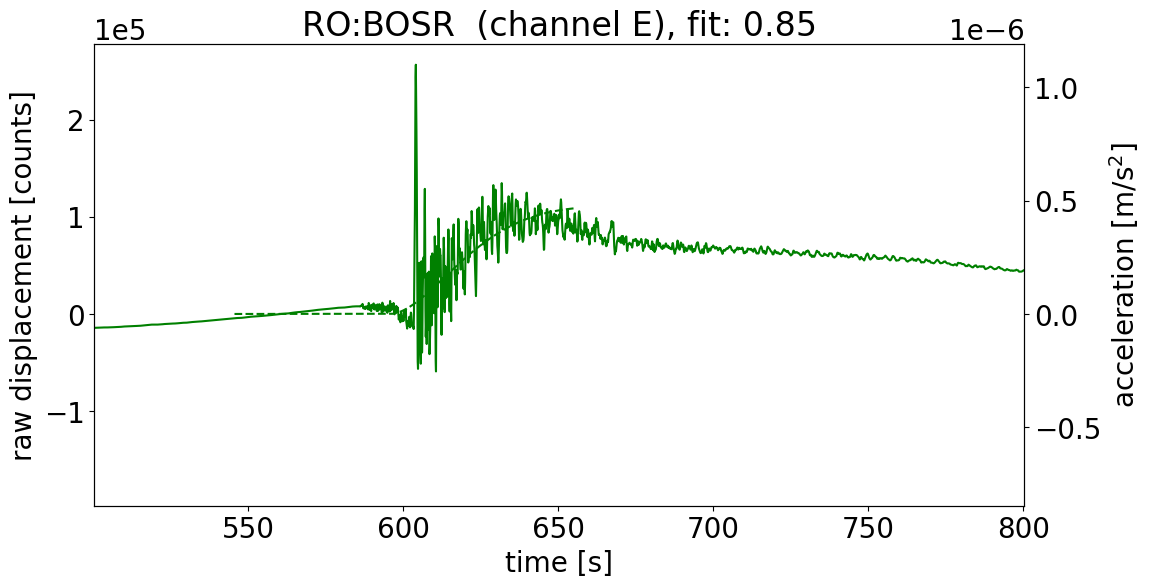
BOSR HHE: MOUSE detected, ignoring component in inversion (time of onset: 35.3 s, amplitude: 4.72e-07 m s^-2, fit: 0.85)
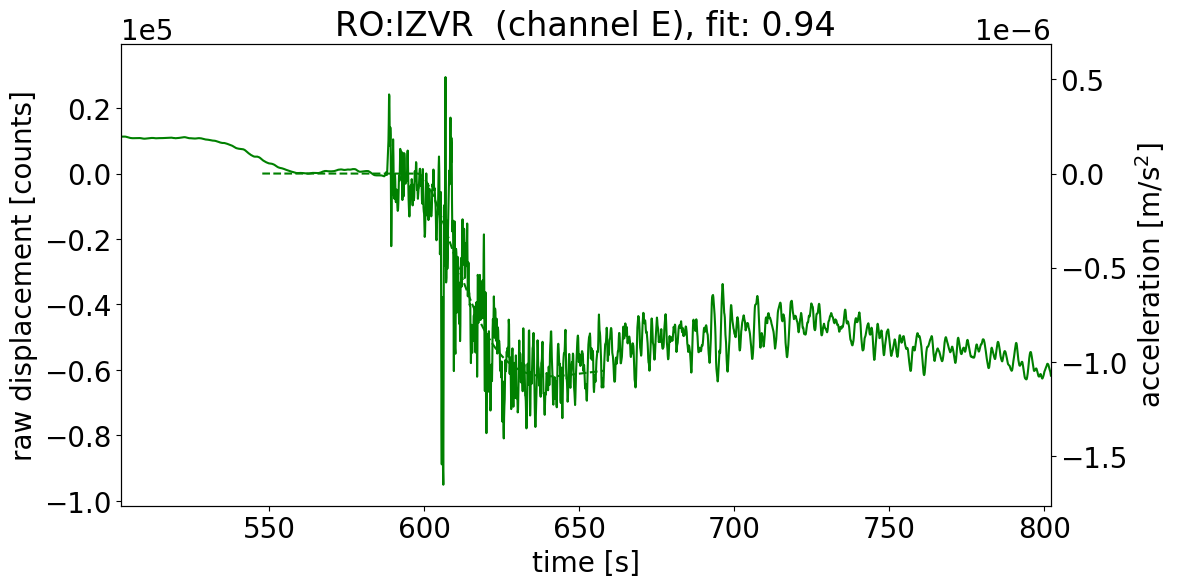
IZVR HHE: MOUSE detected, ignoring component in inversion (time of onset: 35.7 s, amplitude: 1.03e-06 m s^-2, fit: 0.94)
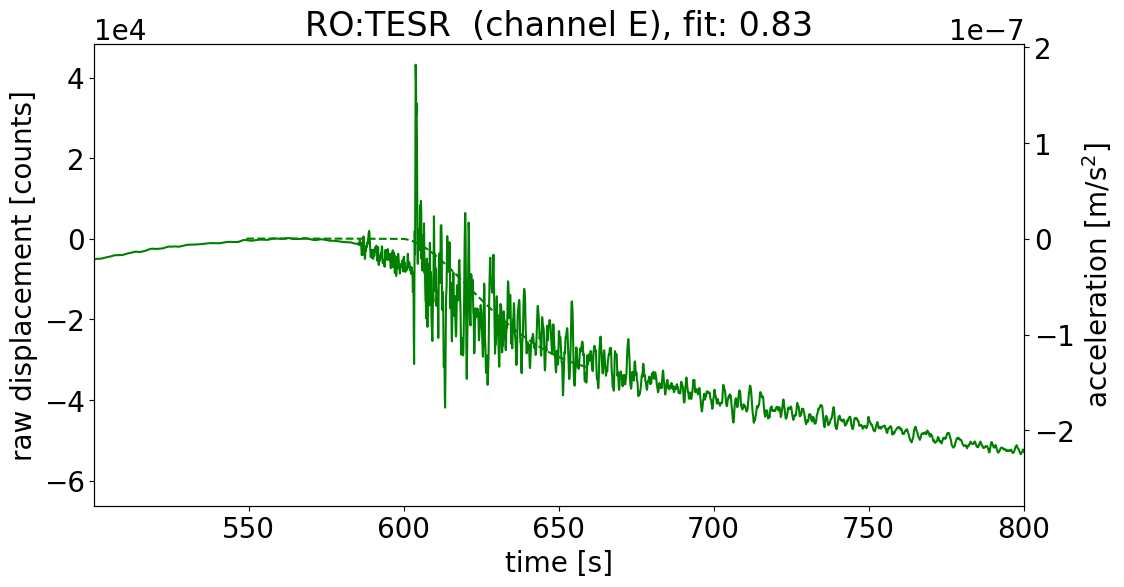
TESR HHE: MOUSE detected, ignoring component in inversion (time of onset: 39.1 s, amplitude: 1.41e-07 m s^-2, fit: 0.83)
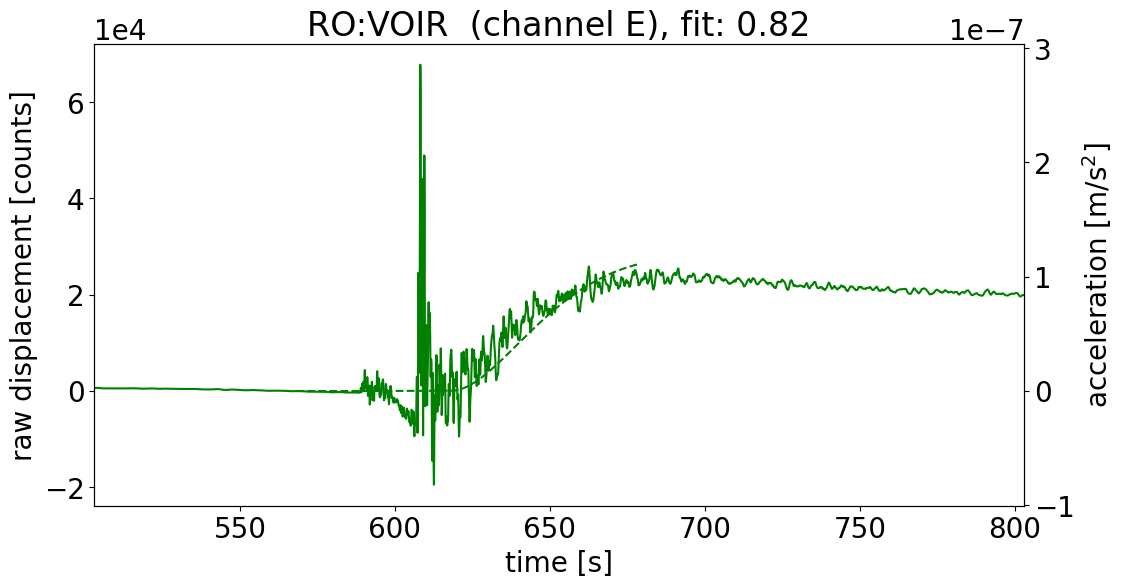
VOIR HHE: MOUSE detected, ignoring component in inversion (time of onset: 55.2 s, amplitude: 1.16e-07 m s^-2, fit: 0.82)
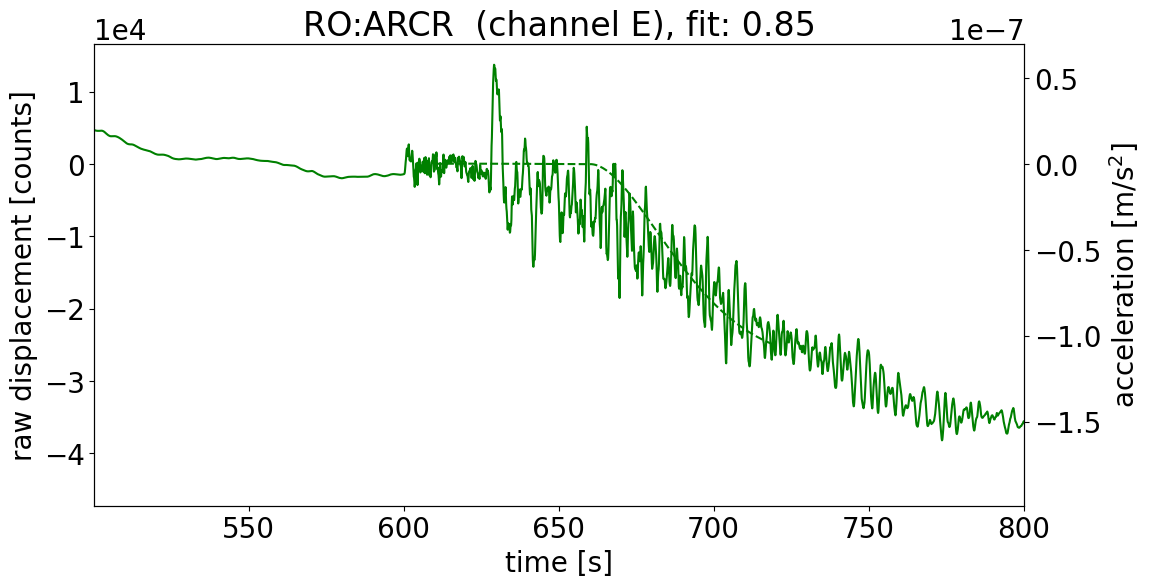
ARCR HHE: MOUSE detected, ignoring component in inversion (time of onset: 100.0 s, amplitude: 1.11e-07 m s^-2, fit: 0.85)
Station coordinates: input/vrancea/2022/nov/network1.stn
Loading data from fdsnws server(s):
http://eida-sc3.infp.ro/fdsnws/
